
Advertisement
Finding a business that has the potential to grow substantially is not easy, but it is possible if we look at a few key financial metrics. Firstly, we'll want to see a proven return on capital employed (ROCE) that is increasing, and secondly, an expanding base of capital employed. Basically this means that a company has profitable initiatives that it can continue to reinvest in, which is a trait of a compounding machine. However, after briefly looking over the numbers, we don't think KDDI (TSE:9433) has the makings of a multi-bagger going forward, but let's have a look at why that may be.
Our free stock report includes 2 warning signs investors should be aware of before investing in KDDI. Read for free now.Understanding Return On Capital Employed (ROCE)
If you haven't worked with ROCE before, it measures the 'return' (pre-tax profit) a company generates from capital employed in its business. Analysts use this formula to calculate it for KDDI:
Return on Capital Employed = Earnings Before Interest and Tax (EBIT) ÷ (Total Assets - Current Liabilities)
0.11 = JP¥950b ÷ (JP¥16t - JP¥7.5t) (Based on the trailing twelve months to December 2024).
Therefore, KDDI has an ROCE of 11%. That's a relatively normal return on capital, and it's around the 12% generated by the Wireless Telecom industry.
View our latest analysis for KDDI
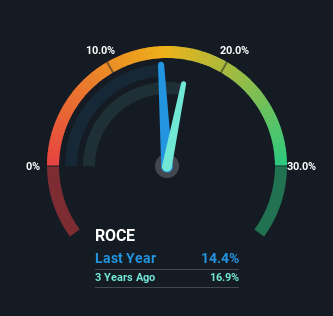
Above you can see how the current ROCE for KDDI compares to its prior returns on capital, but there's only so much you can tell from the past. If you'd like to see what analysts are forecasting going forward, you should check out our free analyst report for KDDI .
So How Is KDDI's ROCE Trending?
On the surface, the trend of ROCE at KDDI doesn't inspire confidence. Over the last five years, returns on capital have decreased to 11% from 16% five years ago. Meanwhile, the business is utilizing more capital but this hasn't moved the needle much in terms of sales in the past 12 months, so this could reflect longer term investments. It's worth keeping an eye on the company's earnings from here on to see if these investments do end up contributing to the bottom line.
While on the subject, we noticed that the ratio of current liabilities to total assets has risen to 46%, which has impacted the ROCE. If current liabilities hadn't increased as much as they did, the ROCE could actually be even lower. And with current liabilities at these levels, suppliers or short-term creditors are effectively funding a large part of the business, which can introduce some risks.
The Bottom Line On KDDI's ROCE
To conclude, we've found that KDDI is reinvesting in the business, but returns have been falling. Although the market must be expecting these trends to improve because the stock has gained 98% over the last five years. Ultimately, if the underlying trends persist, we wouldn't hold our breath on it being a multi-bagger going forward.
KDDI does have some risks though, and we've spotted 2 warning signs for KDDI that you might be interested in.
While KDDI may not currently earn the highest returns, we've compiled a list of companies that currently earn more than 25% return on equity. Check out this free list here.
Valuation is complex, but we're here to simplify it.
Discover if KDDI might be undervalued or overvalued with our detailed analysis, featuring fair value estimates, potential risks, dividends, insider trades, and its financial condition.
Access Free AnalysisHave feedback on this article? Concerned about the content? Get in touch with us directly. Alternatively, email editorial-team (at) simplywallst.com.
This article by Simply Wall St is general in nature. We provide commentary based on historical data and analyst forecasts only using an unbiased methodology and our articles are not intended to be financial advice. It does not constitute a recommendation to buy or sell any stock, and does not take account of your objectives, or your financial situation. We aim to bring you long-term focused analysis driven by fundamental data. Note that our analysis may not factor in the latest price-sensitive company announcements or qualitative material. Simply Wall St has no position in any stocks mentioned.
About TSE:9433
KDDI
Engages in the provision of mobile telecommunications services in Japan and internationally.
Undervalued with proven track record and pays a dividend.
Similar Companies
Market Insights

Advertisement
Community Narratives
MicroVision will explode future revenue by 380.37% with a vision towards success
Fair Value US$60|98.4% undervalued
TH
Community Contributor
The Indispensable Artery for a New North American Economy
Fair Value CA$132.87|0.6% undervalued
TI
Community Contributor
Recently Updated Narratives
BL


BlackGoat on Alphabet ·
Alphabet: The Under-appreciated Compounder Hiding in Plain Sight
Fair Value:US$324.481.3% undervalued
74 followersusers have followed this narrative
3 commentsusers have commented on this narrative
1 likeusers have liked this narrative
BE


Bejgal on MINISO Group Holding ·
MINISO's fair value is projected at 26.69 with an anticipated PE ratio shift of 20x
Fair Value:US$26.6926.7% undervalued
45 followersusers have followed this narrative
3 commentsusers have commented on this narrative
0 likesusers have liked this narrative
TI


TickerTickle on Oracle ·
The Quiet Giant That Became AI’s Power Grid
Fair Value:US$389.8147.4% undervalued
9 followersusers have followed this narrative
1 commentusers have commented on this narrative
0 likesusers have liked this narrative
Popular Narratives
OS

oscargarcia on Alphabet ·
The company that turned a verb into a global necessity and basically runs the modern internet, digital ads, smartphones, maps, and AI.
Fair Value:US$3405.9% undervalued
136 followersusers have followed this narrative
6 commentsusers have commented on this narrative
18 likesusers have liked this narrative
TH

TheWallstreetKing on MicroVision ·
MicroVision will explode future revenue by 380.37% with a vision towards success
Fair Value:US$6098.4% undervalued
89 followersusers have followed this narrative
10 commentsusers have commented on this narrative
18 likesusers have liked this narrative
AN


AnalystConsensusTarget on NVIDIA ·
NVDA: Expanding AI Demand Will Drive Major Data Center Investments Through 2026
Fair Value:US$232.7922.6% undervalued
927 followersusers have followed this narrative
6 commentsusers have commented on this narrative
22 likesusers have liked this narrative