Advertisement
- Japan
- /
- Electronic Equipment and Components
- /
- TSE:7701
Shimadzu (TSE:7701): Evaluating Valuation Following Measuring Instruments Business Briefing and Renewed Investor Focus

Simply Wall St
Reviewed by Simply Wall St
If you follow Shimadzu (TSE:7701), you probably noticed the company just held a special business briefing session focused on its measuring instruments division. While these types of briefings do not always move markets, they can catch investors' attention, especially when there is anticipation around strategic updates or hints at future performance. The event is sparking a renewed conversation about what is coming next from one of Japan’s key tech and scientific equipment suppliers.
This uptick in attention comes at an interesting moment for Shimadzu. Despite a small positive move in the past month, the stock remains down 19% for the year, reflecting a choppy period after several years of steady expansion. Momentum appears mixed, with short-term gains offset by longer-term declines, even as key financials like annual revenue and net income keep growing.
After this recent business briefing and a year of sliding prices, is the market leaving room for upside, or are investors already pricing in growth from Shimadzu’s core businesses?
Price-to-Earnings of 20.7x: Is it justified?
Based on its price-to-earnings (P/E) ratio, Shimadzu currently trades at a premium relative to both its industry and estimated fair value multiples. This suggests the market is pricing in either stronger expected growth or stability that may not be present compared to its sector peers.
The P/E ratio measures how much investors are willing to pay for each yen of company earnings. It provides a gauge of whether a stock is expensive or cheap relative to company profits. For technology and scientific equipment suppliers like Shimadzu, it serves as a critical benchmark given the industry's focus on innovation-driven earnings as well as cyclical business risks.
With Shimadzu’s P/E ratio of 20.7x exceeding both the Japanese electronics industry average of 14.6x and an estimated fair P/E of 16.9x, the market appears to be assigning a higher value to each yen of current earnings. This could indicate expectations for improved operational performance or future growth that are not yet supported by recent results, or simply over-optimism in a competitive landscape.
Result: Fair Value of ¥3,619.33 (OVERVALUED)
See our latest analysis for Shimadzu.However, slowing revenue growth and continued share price weakness could challenge optimism around Shimadzu. This may test the durability of current market expectations.
Find out about the key risks to this Shimadzu narrative.Another View: What Does Our DCF Model Say?
Taking a different angle, our DCF model offers a fresh perspective. It suggests shares may not be as attractively valued as some hope, reflecting the caution seen in market multiples. Could future changes shift the outlook?
Look into how the SWS DCF model arrives at its fair value.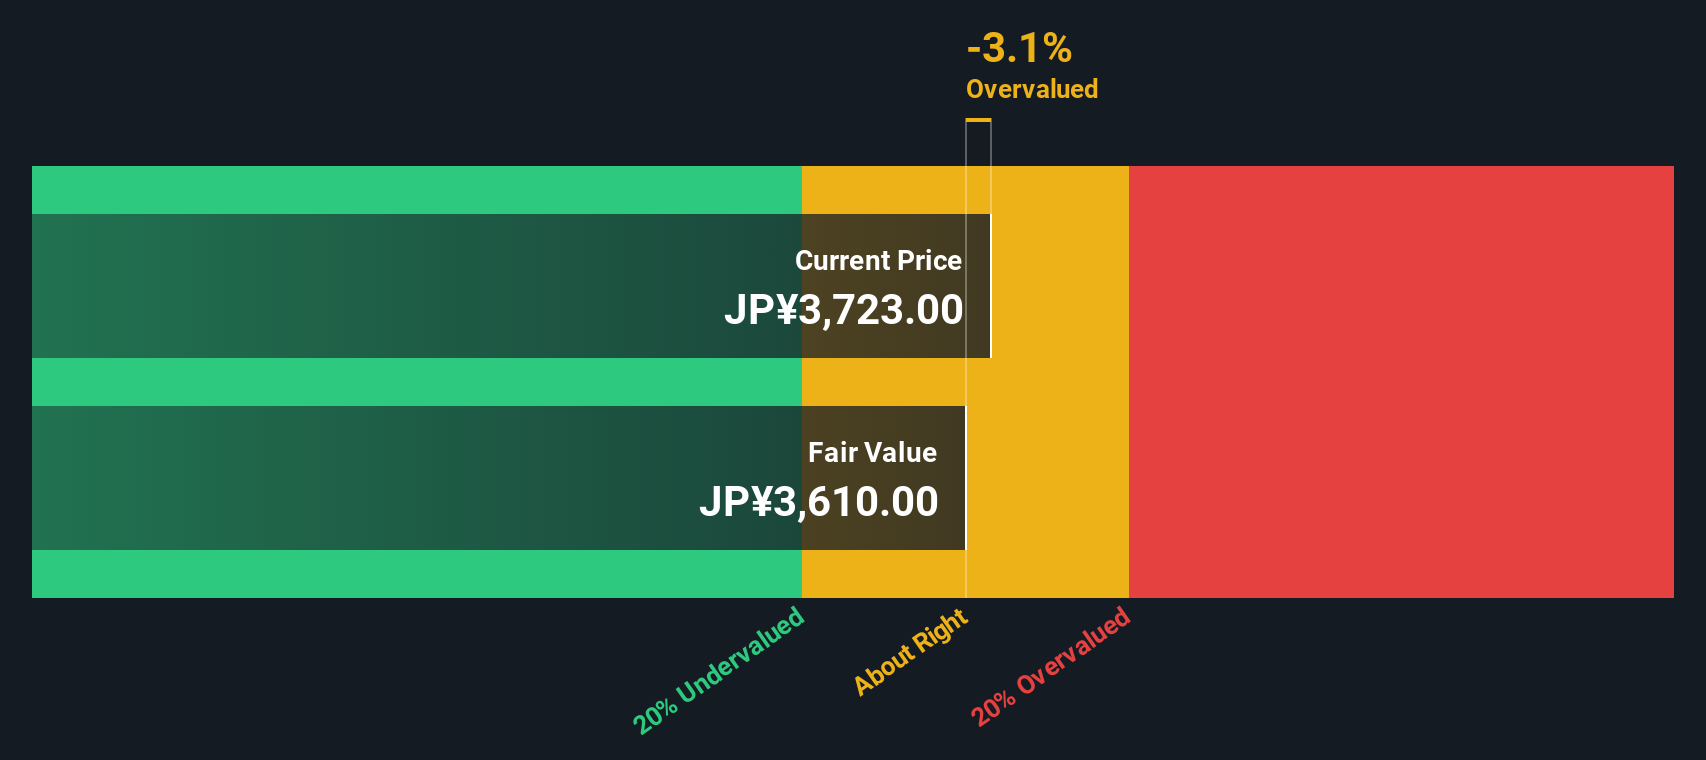
Build Your Own Shimadzu Narrative
If you have a different perspective or want to dig deeper into the numbers, you can craft your own Shimadzu view in just a few minutes. Do it your way
A great starting point for your Shimadzu research is our analysis highlighting 1 key reward and 1 important warning sign that could impact your investment decision.
Looking for more investment ideas?
Ready to spot your next portfolio win? Don’t let new opportunities slip by. Use Simply Wall Street’s powerful tools to zero in on remarkable companies making waves right now.
- Target strong yielding opportunities and boost your passive income by checking out dividend stocks with yields > 3%.
- Catch the hottest trends in artificial intelligence by scanning for exceptional innovators in AI penny stocks.
- Find hidden gems trading beneath their true value and seize potential bargains thanks to our spotlight on undervalued stocks based on cash flows.
This article by Simply Wall St is general in nature. We provide commentary based on historical data and analyst forecasts only using an unbiased methodology and our articles are not intended to be financial advice. It does not constitute a recommendation to buy or sell any stock, and does not take account of your objectives, or your financial situation. We aim to bring you long-term focused analysis driven by fundamental data. Note that our analysis may not factor in the latest price-sensitive company announcements or qualitative material. Simply Wall St has no position in any stocks mentioned.
New: Manage All Your Stock Portfolios in One Place
We've created the ultimate portfolio companion for stock investors, and it's free.
• Connect an unlimited number of Portfolios and see your total in one currency
• Be alerted to new Warning Signs or Risks via email or mobile
• Track the Fair Value of your stocks
Have feedback on this article? Concerned about the content? Get in touch with us directly. Alternatively, email editorial-team@simplywallst.com
About TSE:7701
Flawless balance sheet average dividend payer.
Similar Companies
Market Insights

Advertisement
Community Narratives
Quality at a Premium. A time to watch, not to buy?
Fair Value US$154.56|29.9% undervalued
DA
Community Contributor
GRAB: The Super-App at the Heart of Southeast Asia’s Digital Boom
Fair Value US$8.20|22.9% undervalued
BL
Community Contributor
Verve Group to Surge with 51.61% Revenue Growth
Fair Value €6.00|64.1% undervalued
ME
Community Contributor