
Advertisement
- Japan
- /
- Electronic Equipment and Components
- /
- TSE:6856
Does HORIBA (TSE:6856) Have A Healthy Balance Sheet?
Some say volatility, rather than debt, is the best way to think about risk as an investor, but Warren Buffett famously said that 'Volatility is far from synonymous with risk.' It's only natural to consider a company's balance sheet when you examine how risky it is, since debt is often involved when a business collapses. We note that HORIBA, Ltd. (TSE:6856) does have debt on its balance sheet. But is this debt a concern to shareholders?
Why Does Debt Bring Risk?
Debt and other liabilities become risky for a business when it cannot easily fulfill those obligations, either with free cash flow or by raising capital at an attractive price. If things get really bad, the lenders can take control of the business. While that is not too common, we often do see indebted companies permanently diluting shareholders because lenders force them to raise capital at a distressed price. By replacing dilution, though, debt can be an extremely good tool for businesses that need capital to invest in growth at high rates of return. The first thing to do when considering how much debt a business uses is to look at its cash and debt together.
See our latest analysis for HORIBA
What Is HORIBA's Net Debt?
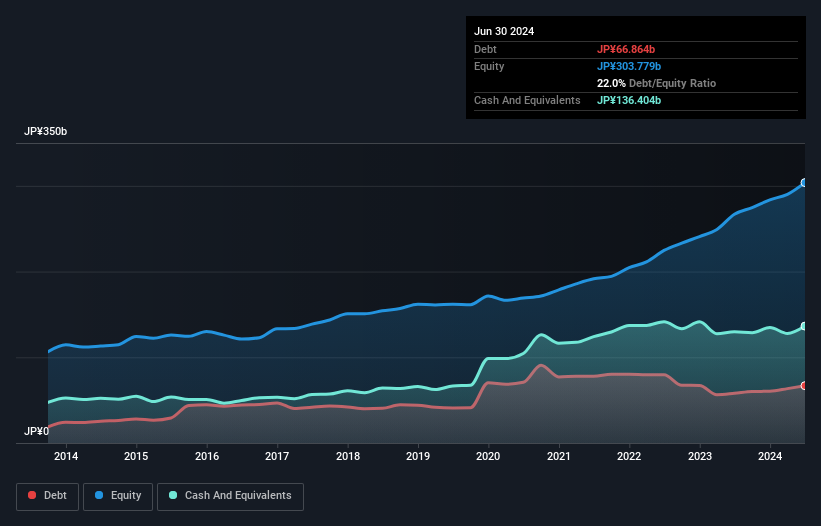
You can click the graphic below for the historical numbers, but it shows that as of June 2024 HORIBA had JP¥66.9b of debt, an increase on JP¥57.9b, over one year. But on the other hand it also has JP¥136.4b in cash, leading to a JP¥69.5b net cash position.
A Look At HORIBA's Liabilities
We can see from the most recent balance sheet that HORIBA had liabilities of JP¥99.7b falling due within a year, and liabilities of JP¥65.9b due beyond that. Offsetting this, it had JP¥136.4b in cash and JP¥66.7b in receivables that were due within 12 months. So it can boast JP¥37.5b more liquid assets than total liabilities.
This surplus suggests that HORIBA has a conservative balance sheet, and could probably eliminate its debt without much difficulty. Simply put, the fact that HORIBA has more cash than debt is arguably a good indication that it can manage its debt safely.
HORIBA's EBIT was pretty flat over the last year, but that shouldn't be an issue given the it doesn't have a lot of debt. When analysing debt levels, the balance sheet is the obvious place to start. But ultimately the future profitability of the business will decide if HORIBA can strengthen its balance sheet over time. So if you want to see what the professionals think, you might find this free report on analyst profit forecasts to be interesting.
Finally, a company can only pay off debt with cold hard cash, not accounting profits. While HORIBA has net cash on its balance sheet, it's still worth taking a look at its ability to convert earnings before interest and tax (EBIT) to free cash flow, to help us understand how quickly it is building (or eroding) that cash balance. In the last three years, HORIBA's free cash flow amounted to 35% of its EBIT, less than we'd expect. That weak cash conversion makes it more difficult to handle indebtedness.
Summing Up
While we empathize with investors who find debt concerning, you should keep in mind that HORIBA has net cash of JP¥69.5b, as well as more liquid assets than liabilities. So we are not troubled with HORIBA's debt use. When analysing debt levels, the balance sheet is the obvious place to start. But ultimately, every company can contain risks that exist outside of the balance sheet. We've identified 2 warning signs with HORIBA , and understanding them should be part of your investment process.
If, after all that, you're more interested in a fast growing company with a rock-solid balance sheet, then check out our list of net cash growth stocks without delay.
Valuation is complex, but we're here to simplify it.
Discover if HORIBA might be undervalued or overvalued with our detailed analysis, featuring fair value estimates, potential risks, dividends, insider trades, and its financial condition.
Access Free AnalysisHave feedback on this article? Concerned about the content? Get in touch with us directly. Alternatively, email editorial-team (at) simplywallst.com.
This article by Simply Wall St is general in nature. We provide commentary based on historical data and analyst forecasts only using an unbiased methodology and our articles are not intended to be financial advice. It does not constitute a recommendation to buy or sell any stock, and does not take account of your objectives, or your financial situation. We aim to bring you long-term focused analysis driven by fundamental data. Note that our analysis may not factor in the latest price-sensitive company announcements or qualitative material. Simply Wall St has no position in any stocks mentioned.
About TSE:6856
HORIBA
Provides analytical and measurement solutions in Japan and internationally.
Flawless balance sheet with proven track record and pays a dividend.
Similar Companies
Market Insights

Advertisement
Weekly Picks
RO


RockeTeller on Santacruz Silver Mining ·
Crazy Undervalued 42 Baggers Silver Play (Active & Running Mine)
Fair Value:CA$8696.4% undervalued
41 followersusers have followed this narrative
6 commentsusers have commented on this narrative
14 likesusers have liked this narrative
RO


Robbo on Fiducian Group ·
Fiducian: Compliance Clouds or Value Opportunity?
Fair Value:AU$123.8% undervalued
5 followersusers have followed this narrative
0 commentsusers have commented on this narrative
0 likesusers have liked this narrative
WO

woodworthfund on Willamette Valley Vineyards ·
Willamette Valley Vineyards (WVVI): Not-So-Great Value
Fair Value:US$244.5% overvalued
7 followersusers have followed this narrative
0 commentsusers have commented on this narrative
1 likeusers have liked this narrative
Recently Updated Narratives
SC

scm on Text ·
TXT will see revenue grow 26% with a profit margin boost of almost 40%
Fair Value:zł8049.8% undervalued
3 followersusers have followed this narrative
0 commentsusers have commented on this narrative
0 likesusers have liked this narrative
VL

Vladislav on Galleon Gold ·
Significantly undervalued gold explorer in Timmins, finally getting traction
Fair Value:CA$482.9% undervalued
2 followersusers have followed this narrative
0 commentsusers have commented on this narrative
0 likesusers have liked this narrative
FU

FundamentallySarcastic on Credit Corp Group ·
Moderation and Stabilisation: HOLD: Fair Price based on a 4-year Cycle is $12.08
Fair Value:AU$12.6411.8% overvalued
3 followersusers have followed this narrative
0 commentsusers have commented on this narrative
0 likesusers have liked this narrative
Popular Narratives
TH


TheWallstreetKing on MicroVision ·
MicroVision will explode future revenue by 380.37% with a vision towards success
Fair Value:US$6098.5% undervalued
116 followersusers have followed this narrative
11 commentsusers have commented on this narrative
22 likesusers have liked this narrative
AN


AnalystConsensusTarget on NVIDIA ·
NVDA: Expanding AI Demand Will Drive Major Data Center Investments Through 2026
Fair Value:US$250.3928.3% undervalued
955 followersusers have followed this narrative
6 commentsusers have commented on this narrative
25 likesusers have liked this narrative
OS


oscargarcia on Alphabet ·
The company that turned a verb into a global necessity and basically runs the modern internet, digital ads, smartphones, maps, and AI.
Fair Value:US$3406.0% undervalued
147 followersusers have followed this narrative
6 commentsusers have commented on this narrative
18 likesusers have liked this narrative

