- Japan
- /
- Electronic Equipment and Components
- /
- TSE:6762
TDK Corporation (TSE:6762) Stock Has Shown Weakness Lately But Financials Look Strong: Should Prospective Shareholders Make The Leap?


TDK (TSE:6762) has had a rough three months with its share price down 11%. However, stock prices are usually driven by a company’s financial performance over the long term, which in this case looks quite promising. Particularly, we will be paying attention to TDK's ROE today.
ROE or return on equity is a useful tool to assess how effectively a company can generate returns on the investment it received from its shareholders. Simply put, it is used to assess the profitability of a company in relation to its equity capital.
View our latest analysis for TDK
How To Calculate Return On Equity?
ROE can be calculated by using the formula:
Return on Equity = Net Profit (from continuing operations) ÷ Shareholders' Equity
So, based on the above formula, the ROE for TDK is:
8.9% = JP¥169b ÷ JP¥1.9t (Based on the trailing twelve months to December 2024).
The 'return' refers to a company's earnings over the last year. That means that for every ¥1 worth of shareholders' equity, the company generated ¥0.09 in profit.
Why Is ROE Important For Earnings Growth?
We have already established that ROE serves as an efficient profit-generating gauge for a company's future earnings. Depending on how much of these profits the company reinvests or "retains", and how effectively it does so, we are then able to assess a company’s earnings growth potential. Assuming everything else remains unchanged, the higher the ROE and profit retention, the higher the growth rate of a company compared to companies that don't necessarily bear these characteristics.
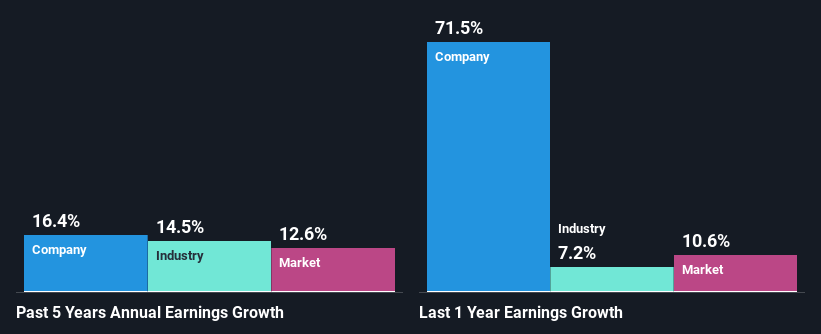
TDK's Earnings Growth And 8.9% ROE
At first glance, TDK seems to have a decent ROE. Even when compared to the industry average of 8.2% the company's ROE looks quite decent. This certainly adds some context to TDK's moderate 16% net income growth seen over the past five years.
Next, on comparing TDK's net income growth with the industry, we found that the company's reported growth is similar to the industry average growth rate of 15% over the last few years.
Earnings growth is a huge factor in stock valuation. The investor should try to establish if the expected growth or decline in earnings, whichever the case may be, is priced in. By doing so, they will have an idea if the stock is headed into clear blue waters or if swampy waters await. Has the market priced in the future outlook for 6762? You can find out in our latest intrinsic value infographic research report.
Is TDK Efficiently Re-investing Its Profits?
TDK has a three-year median payout ratio of 29%, which implies that it retains the remaining 71% of its profits. This suggests that its dividend is well covered, and given the decent growth seen by the company, it looks like management is reinvesting its earnings efficiently.
Moreover, TDK is determined to keep sharing its profits with shareholders which we infer from its long history of paying a dividend for at least ten years.
Summary
On the whole, we feel that TDK's performance has been quite good. In particular, it's great to see that the company is investing heavily into its business and along with a high rate of return, that has resulted in a sizeable growth in its earnings. With that said, the latest industry analyst forecasts reveal that the company's earnings growth is expected to slow down. To know more about the company's future earnings growth forecasts take a look at this free report on analyst forecasts for the company to find out more.
Valuation is complex, but we're here to simplify it.
Discover if TDK might be undervalued or overvalued with our detailed analysis, featuring fair value estimates, potential risks, dividends, insider trades, and its financial condition.
Access Free AnalysisHave feedback on this article? Concerned about the content? Get in touch with us directly. Alternatively, email editorial-team (at) simplywallst.com.
This article by Simply Wall St is general in nature. We provide commentary based on historical data and analyst forecasts only using an unbiased methodology and our articles are not intended to be financial advice. It does not constitute a recommendation to buy or sell any stock, and does not take account of your objectives, or your financial situation. We aim to bring you long-term focused analysis driven by fundamental data. Note that our analysis may not factor in the latest price-sensitive company announcements or qualitative material. Simply Wall St has no position in any stocks mentioned.
About TSE:6762
TDK
Engages in manufacture and sale of electronic components in Japan, Europe, China, Asia, the Americas, and internationally.
Flawless balance sheet with solid track record.
Similar Companies
Market Insights

Community Narratives

