- Japan
- /
- Tech Hardware
- /
- TSE:6670
MCJ Co., Ltd. (TSE:6670) Looks Interesting, And It's About To Pay A Dividend


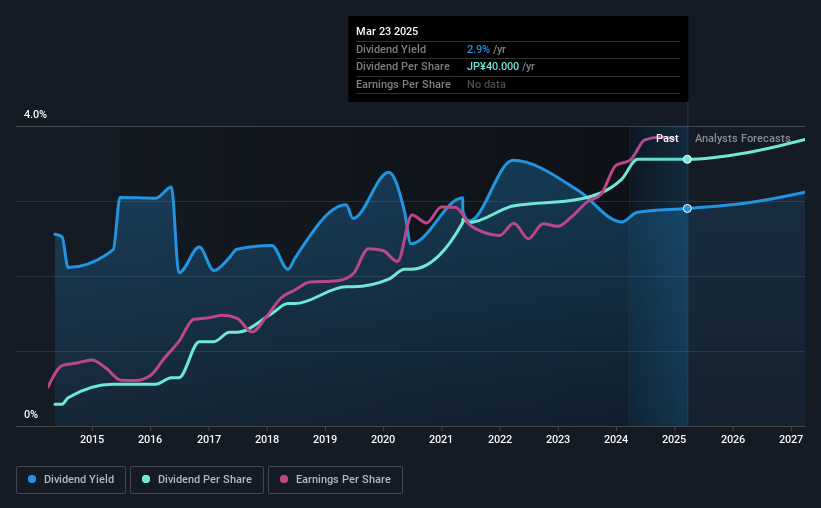
It looks like MCJ Co., Ltd. (TSE:6670) is about to go ex-dividend in the next three days. The ex-dividend date is commonly two business days before the record date, which is the cut-off date for shareholders to be present on the company's books to be eligible for a dividend payment. The ex-dividend date is important as the process of settlement involves at least two full business days. So if you miss that date, you would not show up on the company's books on the record date. Therefore, if you purchase MCJ's shares on or after the 28th of March, you won't be eligible to receive the dividend, when it is paid on the 26th of June.
The company's next dividend payment will be JP¥40.00 per share, and in the last 12 months, the company paid a total of JP¥40.00 per share. Based on the last year's worth of payments, MCJ has a trailing yield of 2.9% on the current stock price of JP¥1379.00. We love seeing companies pay a dividend, but it's also important to be sure that laying the golden eggs isn't going to kill our golden goose! We need to see whether the dividend is covered by earnings and if it's growing.
If a company pays out more in dividends than it earned, then the dividend might become unsustainable - hardly an ideal situation. Fortunately MCJ's payout ratio is modest, at just 28% of profit. That said, even highly profitable companies sometimes might not generate enough cash to pay the dividend, which is why we should always check if the dividend is covered by cash flow. Fortunately, it paid out only 30% of its free cash flow in the past year.
It's positive to see that MCJ's dividend is covered by both profits and cash flow, since this is generally a sign that the dividend is sustainable, and a lower payout ratio usually suggests a greater margin of safety before the dividend gets cut.
View our latest analysis for MCJ
Click here to see how much of its profit MCJ paid out over the last 12 months.
Have Earnings And Dividends Been Growing?
Stocks in companies that generate sustainable earnings growth often make the best dividend prospects, as it is easier to lift the dividend when earnings are rising. If earnings fall far enough, the company could be forced to cut its dividend. Fortunately for readers, MCJ's earnings per share have been growing at 15% a year for the past five years. Earnings per share are growing rapidly and the company is keeping more than half of its earnings within the business; an attractive combination which could suggest the company is focused on reinvesting to grow earnings further. Fast-growing businesses that are reinvesting heavily are enticing from a dividend perspective, especially since they can often increase the payout ratio later.
Another key way to measure a company's dividend prospects is by measuring its historical rate of dividend growth. MCJ has delivered an average of 28% per year annual increase in its dividend, based on the past 10 years of dividend payments. It's exciting to see that both earnings and dividends per share have grown rapidly over the past few years.
To Sum It Up
From a dividend perspective, should investors buy or avoid MCJ? MCJ has been growing earnings at a rapid rate, and has a conservatively low payout ratio, implying that it is reinvesting heavily in its business; a sterling combination. There's a lot to like about MCJ, and we would prioritise taking a closer look at it.
Want to learn more about MCJ? Here's a visualisation of its historical rate of revenue and earnings growth.
A common investing mistake is buying the first interesting stock you see. Here you can find a full list of high-yield dividend stocks.
If you're looking to trade MCJ, open an account with the lowest-cost platform trusted by professionals, Interactive Brokers.
With clients in over 200 countries and territories, and access to 160 markets, IBKR lets you trade stocks, options, futures, forex, bonds and funds from a single integrated account.
Enjoy no hidden fees, no account minimums, and FX conversion rates as low as 0.03%, far better than what most brokers offer.
Sponsored ContentNew: Manage All Your Stock Portfolios in One Place
We've created the ultimate portfolio companion for stock investors, and it's free.
• Connect an unlimited number of Portfolios and see your total in one currency
• Be alerted to new Warning Signs or Risks via email or mobile
• Track the Fair Value of your stocks
Have feedback on this article? Concerned about the content? Get in touch with us directly. Alternatively, email editorial-team (at) simplywallst.com.
This article by Simply Wall St is general in nature. We provide commentary based on historical data and analyst forecasts only using an unbiased methodology and our articles are not intended to be financial advice. It does not constitute a recommendation to buy or sell any stock, and does not take account of your objectives, or your financial situation. We aim to bring you long-term focused analysis driven by fundamental data. Note that our analysis may not factor in the latest price-sensitive company announcements or qualitative material. Simply Wall St has no position in any stocks mentioned.
About TSE:6670
Flawless balance sheet, undervalued and pays a dividend.
Market Insights


Community Narratives
