- Japan
- /
- Electronic Equipment and Components
- /
- TSE:6645
Further weakness as OMRON (TSE:6645) drops 5.5% this week, taking three-year losses to 54%

If you are building a properly diversified stock portfolio, the chances are some of your picks will perform badly. Long term OMRON Corporation (TSE:6645) shareholders know that all too well, since the share price is down considerably over three years. So they might be feeling emotional about the 56% share price collapse, in that time. The more recent news is of little comfort, with the share price down 22% in a year. Unfortunately the share price momentum is still quite negative, with prices down 21% in thirty days. This could be related to the recent financial results - you can catch up on the most recent data by reading our company report.
Since OMRON has shed JP¥56b from its value in the past 7 days, let's see if the longer term decline has been driven by the business' economics.
View our latest analysis for OMRON
While markets are a powerful pricing mechanism, share prices reflect investor sentiment, not just underlying business performance. By comparing earnings per share (EPS) and share price changes over time, we can get a feel for how investor attitudes to a company have morphed over time.
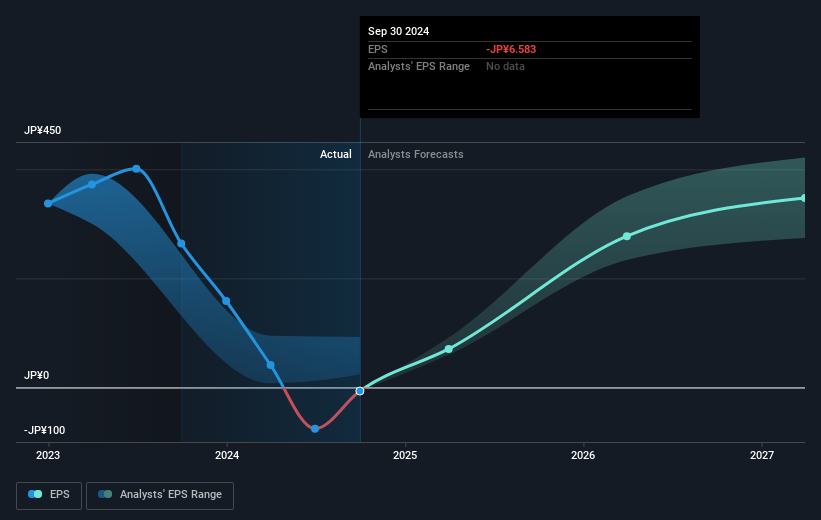
Over the three years that the share price declined, OMRON's earnings per share (EPS) dropped significantly, falling to a loss. Extraordinary items contributed to this situation. Since the company has fallen to a loss making position, it's hard to compare the change in EPS with the share price change. However, we can say we'd expect to see a falling share price in this scenario.
You can see below how EPS has changed over time (discover the exact values by clicking on the image).

This free interactive report on OMRON's earnings, revenue and cash flow is a great place to start, if you want to investigate the stock further.
A Different Perspective
OMRON shareholders are down 21% for the year (even including dividends), but the market itself is up 14%. However, keep in mind that even the best stocks will sometimes underperform the market over a twelve month period. Regrettably, last year's performance caps off a bad run, with the shareholders facing a total loss of 4% per year over five years. Generally speaking long term share price weakness can be a bad sign, though contrarian investors might want to research the stock in hope of a turnaround. While it is well worth considering the different impacts that market conditions can have on the share price, there are other factors that are even more important. To that end, you should be aware of the 1 warning sign we've spotted with OMRON .
Of course OMRON may not be the best stock to buy. So you may wish to see this free collection of growth stocks.
Please note, the market returns quoted in this article reflect the market weighted average returns of stocks that currently trade on Japanese exchanges.
New: AI Stock Screener & Alerts
Our new AI Stock Screener scans the market every day to uncover opportunities.
• Dividend Powerhouses (3%+ Yield)
• Undervalued Small Caps with Insider Buying
• High growth Tech and AI Companies
Or build your own from over 50 metrics.
Have feedback on this article? Concerned about the content? Get in touch with us directly. Alternatively, email editorial-team (at) simplywallst.com.
This article by Simply Wall St is general in nature. We provide commentary based on historical data and analyst forecasts only using an unbiased methodology and our articles are not intended to be financial advice. It does not constitute a recommendation to buy or sell any stock, and does not take account of your objectives, or your financial situation. We aim to bring you long-term focused analysis driven by fundamental data. Note that our analysis may not factor in the latest price-sensitive company announcements or qualitative material. Simply Wall St has no position in any stocks mentioned.
About TSE:6645
OMRON
Engages in industrial automation, device and module solutions, social systems, and healthcare businesses worldwide.
Excellent balance sheet with reasonable growth potential.
Similar Companies
Market Insights
Community Narratives


