
Advertisement
Warren Buffett famously said, 'Volatility is far from synonymous with risk.' So it might be obvious that you need to consider debt, when you think about how risky any given stock is, because too much debt can sink a company. We can see that f-code Inc. (TSE:9211) does use debt in its business. But is this debt a concern to shareholders?
When Is Debt Dangerous?
Debt and other liabilities become risky for a business when it cannot easily fulfill those obligations, either with free cash flow or by raising capital at an attractive price. If things get really bad, the lenders can take control of the business. However, a more frequent (but still costly) occurrence is where a company must issue shares at bargain-basement prices, permanently diluting shareholders, just to shore up its balance sheet. Of course, the upside of debt is that it often represents cheap capital, especially when it replaces dilution in a company with the ability to reinvest at high rates of return. The first step when considering a company's debt levels is to consider its cash and debt together.
How Much Debt Does f-code Carry?
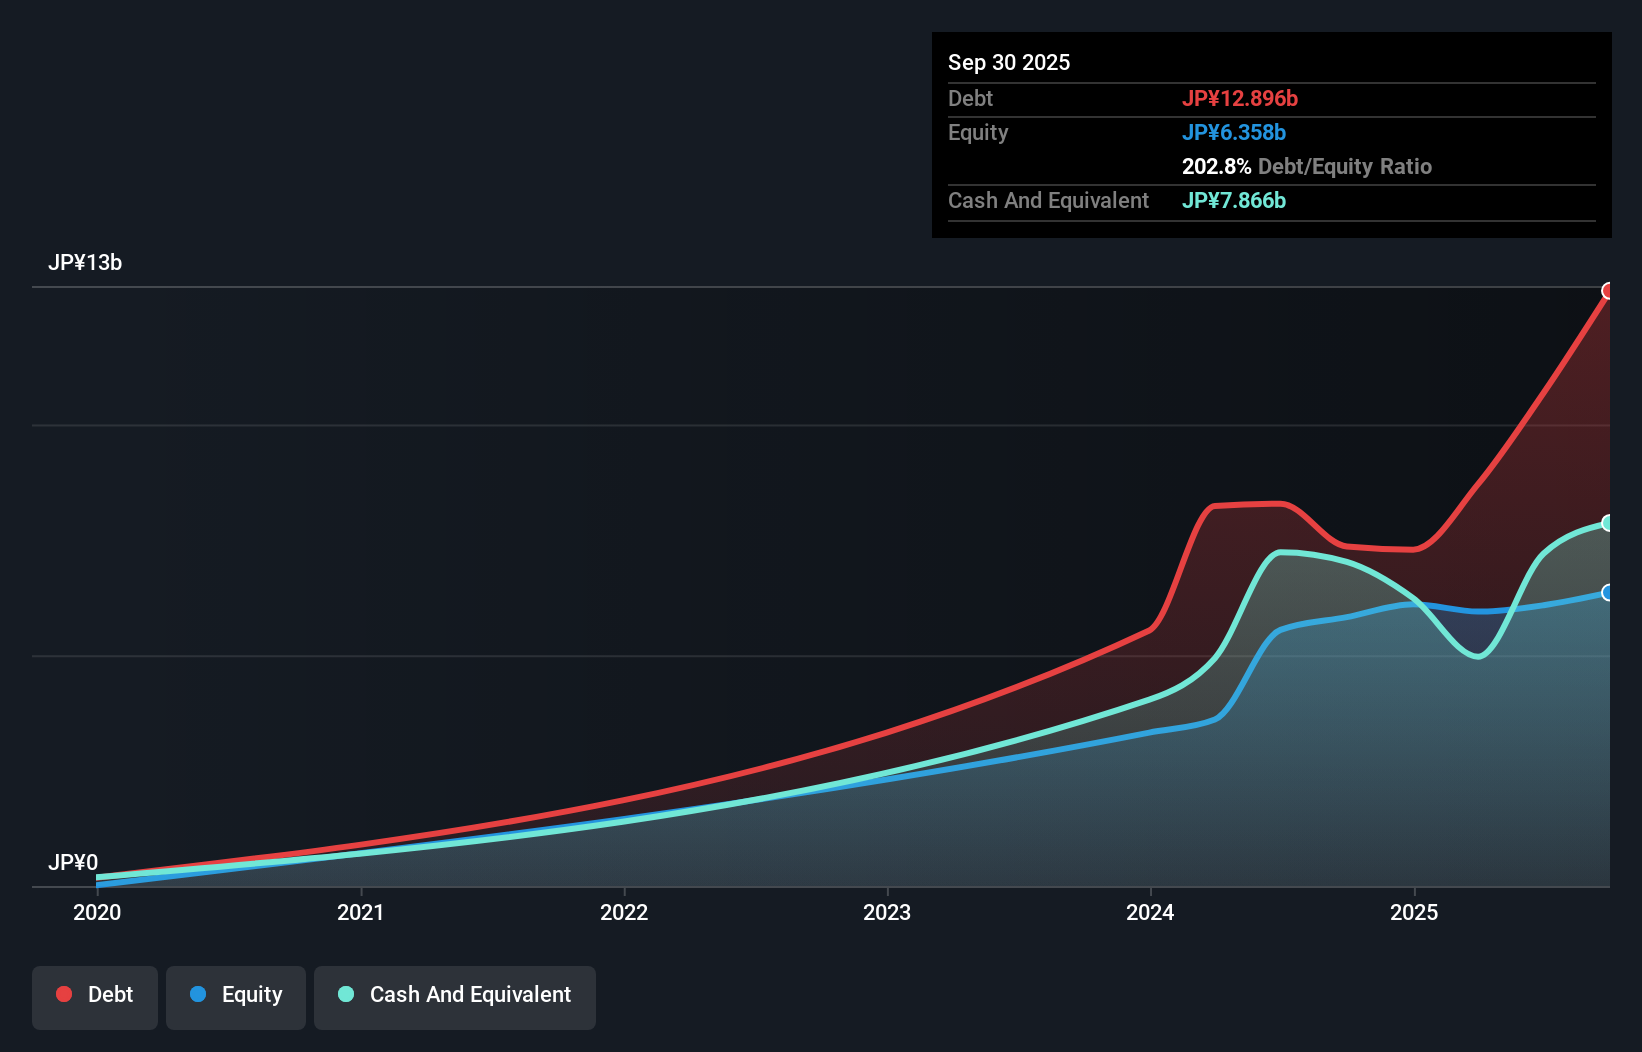
As you can see below, at the end of September 2025, f-code had JP¥12.9b of debt, up from JP¥7.36b a year ago. Click the image for more detail. However, it does have JP¥7.87b in cash offsetting this, leading to net debt of about JP¥5.03b.
How Healthy Is f-code's Balance Sheet?
According to the last reported balance sheet, f-code had liabilities of JP¥7.81b due within 12 months, and liabilities of JP¥14.5b due beyond 12 months. Offsetting this, it had JP¥7.87b in cash and JP¥2.45b in receivables that were due within 12 months. So its liabilities total JP¥12.0b more than the combination of its cash and short-term receivables.
This is a mountain of leverage relative to its market capitalization of JP¥19.3b. This suggests shareholders would be heavily diluted if the company needed to shore up its balance sheet in a hurry.
Check out our latest analysis for f-code
We use two main ratios to inform us about debt levels relative to earnings. The first is net debt divided by earnings before interest, tax, depreciation, and amortization (EBITDA), while the second is how many times its earnings before interest and tax (EBIT) covers its interest expense (or its interest cover, for short). Thus we consider debt relative to earnings both with and without depreciation and amortization expenses.
We'd say that f-code's moderate net debt to EBITDA ratio ( being 1.9), indicates prudence when it comes to debt. And its strong interest cover of 15.8 times, makes us even more comfortable. Notably, f-code's EBIT launched higher than Elon Musk, gaining a whopping 100% on last year. There's no doubt that we learn most about debt from the balance sheet. But it is future earnings, more than anything, that will determine f-code's ability to maintain a healthy balance sheet going forward. So if you're focused on the future you can check out this free report showing analyst profit forecasts.
But our final consideration is also important, because a company cannot pay debt with paper profits; it needs cold hard cash. So the logical step is to look at the proportion of that EBIT that is matched by actual free cash flow. In the last three years, f-code's free cash flow amounted to 48% of its EBIT, less than we'd expect. That weak cash conversion makes it more difficult to handle indebtedness.
Our View
Happily, f-code's impressive interest cover implies it has the upper hand on its debt. But, on a more sombre note, we are a little concerned by its level of total liabilities. Looking at all the aforementioned factors together, it strikes us that f-code can handle its debt fairly comfortably. On the plus side, this leverage can boost shareholder returns, but the potential downside is more risk of loss, so it's worth monitoring the balance sheet. There's no doubt that we learn most about debt from the balance sheet. But ultimately, every company can contain risks that exist outside of the balance sheet. For example f-code has 3 warning signs (and 2 which are a bit unpleasant) we think you should know about.
If, after all that, you're more interested in a fast growing company with a rock-solid balance sheet, then check out our list of net cash growth stocks without delay.
Valuation is complex, but we're here to simplify it.
Discover if f-code might be undervalued or overvalued with our detailed analysis, featuring fair value estimates, potential risks, dividends, insider trades, and its financial condition.
Access Free AnalysisHave feedback on this article? Concerned about the content? Get in touch with us directly. Alternatively, email editorial-team (at) simplywallst.com.
This article by Simply Wall St is general in nature. We provide commentary based on historical data and analyst forecasts only using an unbiased methodology and our articles are not intended to be financial advice. It does not constitute a recommendation to buy or sell any stock, and does not take account of your objectives, or your financial situation. We aim to bring you long-term focused analysis driven by fundamental data. Note that our analysis may not factor in the latest price-sensitive company announcements or qualitative material. Simply Wall St has no position in any stocks mentioned.
MI

The Foxhole
A landmark settlement is meant to punish Meta (META). If the 1998 tobacco deal is any guide, it might protect it.
199
ZO
zoe_vi5fn
Any moat with an opt-out clause for your competitors is just a fence around your own garden.
CO
connor_iwn1g
Worth looking at what previous legal action actually did to Meta rather than reaching for tobacco. The FTC's record five billion dollar privacy fine in 2019 was met with the stock rising, because it came in below fears and removed an open question. GDPR was designed to constrain large platforms and increased their share of the European ad market, because compliance cost fell hardest on small intermediaries. The FTC's antitrust case, the one that could genuinely have broken the company up, was decided in Meta's favour last November. The only thing that ever meaningfully hurt the business was Apple changing a tracking default, and Meta out-spent that too, while the ad-tech firms that could not afford to rebuild disappeared. The pattern is not that Meta survives regulation. It is that regulation keeps costing its smaller competitors more.
 Andrew Legget
Market Insights
Great earnings season, but are the earnings real?

At first glance, this was the strongest earnings season in years. But when you look at where the growth actually came from, the story splits into two very different pictures.
10
About TSE:9211
f-code
Engages in the digital transformation and consulting business in Japan.
High growth potential and fair value.
Market Insights


Advertisement
Weekly Picks
LO


Lou_Basenese on Oncolytics Biotech ·
The Team Behind a $2 Billion Johnson & Johnson (JNJ) Deal Just Took Over This $105 Million Cancer Biotech
Fair Value:US$3.575.5% undervalued
36 followersusers have followed this narrative
0 commentsusers have commented on this narrative
11 likesusers have liked this narrative
TR


tripledub on Meta Platforms ·
The $135 Billion Bet That Should Make Every Shareholder Nervous
Fair Value:US$5861.4% undervalued
62 followersusers have followed this narrative
3 commentsusers have commented on this narrative
34 likesusers have liked this narrative
TA


Talos on Voyager Technologies ·
The "Landlord of Orbit" – A Deep Value Play Ahead of the Starlab Era
Fair Value:US$385.291.1% undervalued
66 followersusers have followed this narrative
0 commentsusers have commented on this narrative
6 likesusers have liked this narrative
IV

Ivoed on Uber Technologies ·
Uber’s Valuation Depends On Who Captures The Economics Of Driverless Rides
Fair Value:US$11632.1% undervalued
14 followersusers have followed this narrative
0 commentsusers have commented on this narrative
3 likesusers have liked this narrative
Recently Updated Narratives
LI

Lijo on Accenture ·
A value stock that's undervalued.
Fair Value:US$27029.8% undervalued
8 followersusers have followed this narrative
0 commentsusers have commented on this narrative
0 likesusers have liked this narrative
AR

ariz_scribe on Marti Technologies ·
$MRT at Roth - Pick of the Panel
Fair Value:US$1.9615.3% overvalued
7 followersusers have followed this narrative
0 commentsusers have commented on this narrative
0 likesusers have liked this narrative
ST


StjepanK on Radisson Mining Resources ·
Radisson Mining Is A Clear Multibagger Junior M&A Story
Fair Value:CA$782.7% undervalued
1 followerusers have followed this narrative
0 commentsusers have commented on this narrative
0 likesusers have liked this narrative
Popular Narratives
OS


oscargarcia on NVIDIA ·
The company that went from selling GPUs to gamers to becoming the AI arms dealer of the 21st century.
Fair Value:US$28022.3% undervalued
363 followersusers have followed this narrative
9 commentsusers have commented on this narrative
16 likesusers have liked this narrative
CU

CubanEros on Microsoft ·
A wonderful business at reasonable price.
Fair Value:US$419.9122.3% overvalued
211 followersusers have followed this narrative
0 commentsusers have commented on this narrative
9 likesusers have liked this narrative
JO


John_Eric on MercadoLibre ·
MercadoLibre and the Spreadsheet Trick That Decides Everything
Fair Value:US$7.31k73.1% undervalued
125 followersusers have followed this narrative
3 commentsusers have commented on this narrative
17 likesusers have liked this narrative
Trending Discussion
MA

max_profit on Happiest Minds Technologies ·
sold all my happiest mind , if the owner doesn't want to stick around why would i
0
|0


JE

jean_pierre_lan_dsslz on Mauritius Development Investment Trust ·
Yes, MDIT is simply just a Deposit-long term stock with a good Dividend, no more, no less. It has just declared a Dividend of 0.11 cs payable 21 September 2026. Its price fluctuates between 1.90cs & 2.00cs. No capital gain in the short or medium term.
0
|0