
Advertisement
Some say volatility, rather than debt, is the best way to think about risk as an investor, but Warren Buffett famously said that 'Volatility is far from synonymous with risk.' It's only natural to consider a company's balance sheet when you examine how risky it is, since debt is often involved when a business collapses. As with many other companies Fujitsu Limited (TSE:6702) makes use of debt. But is this debt a concern to shareholders?
When Is Debt A Problem?
Debt is a tool to help businesses grow, but if a business is incapable of paying off its lenders, then it exists at their mercy. Part and parcel of capitalism is the process of 'creative destruction' where failed businesses are mercilessly liquidated by their bankers. However, a more usual (but still expensive) situation is where a company must dilute shareholders at a cheap share price simply to get debt under control. Of course, plenty of companies use debt to fund growth, without any negative consequences. When we think about a company's use of debt, we first look at cash and debt together.
How Much Debt Does Fujitsu Carry?
As you can see below, at the end of March 2025, Fujitsu had JP¥247.1b of debt, up from JP¥96.8b a year ago. Click the image for more detail. However, it does have JP¥236.1b in cash offsetting this, leading to net debt of about JP¥11.0b.
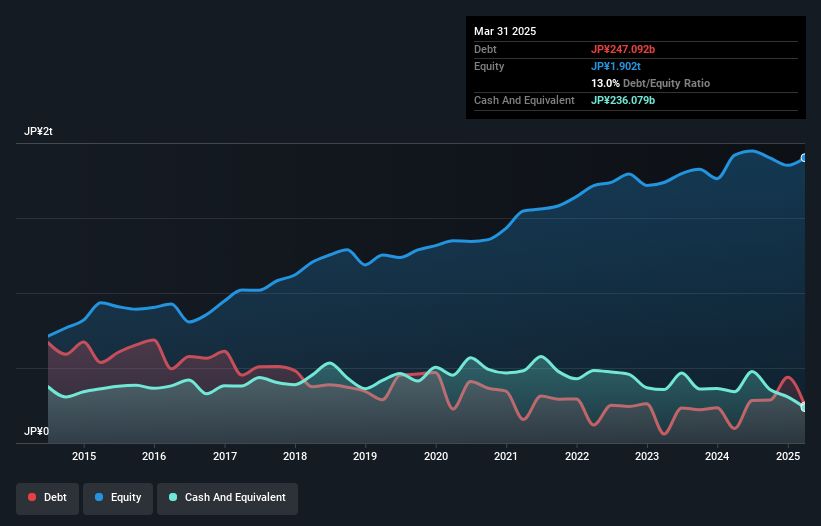
How Healthy Is Fujitsu's Balance Sheet?
According to the last reported balance sheet, Fujitsu had liabilities of JP¥1.35t due within 12 months, and liabilities of JP¥243.7b due beyond 12 months. On the other hand, it had cash of JP¥236.1b and JP¥1.15t worth of receivables due within a year. So it has liabilities totalling JP¥207.5b more than its cash and near-term receivables, combined.
Given Fujitsu has a humongous market capitalization of JP¥5.68t, it's hard to believe these liabilities pose much threat. But there are sufficient liabilities that we would certainly recommend shareholders continue to monitor the balance sheet, going forward. Carrying virtually no net debt, Fujitsu has a very light debt load indeed.
See our latest analysis for Fujitsu
We measure a company's debt load relative to its earnings power by looking at its net debt divided by its earnings before interest, tax, depreciation, and amortization (EBITDA) and by calculating how easily its earnings before interest and tax (EBIT) cover its interest expense (interest cover). Thus we consider debt relative to earnings both with and without depreciation and amortization expenses.
Fujitsu has very modest net debt levels, with net debt at just 0.026 times EBITDA. Humorously, it actually received more in interest over the last twelve months than it had to pay. So it's fair to say it can handle debt like an Olympic ice-skater handles a pirouette. The good news is that Fujitsu has increased its EBIT by 4.8% over twelve months, which should ease any concerns about debt repayment. There's no doubt that we learn most about debt from the balance sheet. But it is future earnings, more than anything, that will determine Fujitsu's ability to maintain a healthy balance sheet going forward. So if you're focused on the future you can check out this free report showing analyst profit forecasts.
Finally, a business needs free cash flow to pay off debt; accounting profits just don't cut it. So the logical step is to look at the proportion of that EBIT that is matched by actual free cash flow. In the last three years, Fujitsu's free cash flow amounted to 39% of its EBIT, less than we'd expect. That's not great, when it comes to paying down debt.
Our View
The good news is that Fujitsu's demonstrated ability to cover its interest expense with its EBIT delights us like a fluffy puppy does a toddler. And the good news does not stop there, as its net debt to EBITDA also supports that impression! Taking all this data into account, it seems to us that Fujitsu takes a pretty sensible approach to debt. While that brings some risk, it can also enhance returns for shareholders. Above most other metrics, we think its important to track how fast earnings per share is growing, if at all. If you've also come to that realization, you're in luck, because today you can view this interactive graph of Fujitsu's earnings per share history for free.
When all is said and done, sometimes its easier to focus on companies that don't even need debt. Readers can access a list of growth stocks with zero net debt 100% free, right now.
New: AI Stock Screener & Alerts
Our new AI Stock Screener scans the market every day to uncover opportunities.
• Dividend Powerhouses (3%+ Yield)
• Undervalued Small Caps with Insider Buying
• High growth Tech and AI Companies
Or build your own from over 50 metrics.
Have feedback on this article? Concerned about the content? Get in touch with us directly. Alternatively, email editorial-team (at) simplywallst.com.
This article by Simply Wall St is general in nature. We provide commentary based on historical data and analyst forecasts only using an unbiased methodology and our articles are not intended to be financial advice. It does not constitute a recommendation to buy or sell any stock, and does not take account of your objectives, or your financial situation. We aim to bring you long-term focused analysis driven by fundamental data. Note that our analysis may not factor in the latest price-sensitive company announcements or qualitative material. Simply Wall St has no position in any stocks mentioned.
MI

The Foxhole
A landmark settlement is meant to punish Meta (META). If the 1998 tobacco deal is any guide, it might protect it.
149
ZO
zoe_vi5fn
Any moat with an opt-out clause for your competitors is just a fence around your own garden.
CO
connor_iwn1g
Worth looking at what previous legal action actually did to Meta rather than reaching for tobacco. The FTC's record five billion dollar privacy fine in 2019 was met with the stock rising, because it came in below fears and removed an open question. GDPR was designed to constrain large platforms and increased their share of the European ad market, because compliance cost fell hardest on small intermediaries. The FTC's antitrust case, the one that could genuinely have broken the company up, was decided in Meta's favour last November. The only thing that ever meaningfully hurt the business was Apple changing a tracking default, and Meta out-spent that too, while the ad-tech firms that could not afford to rebuild disappeared. The pattern is not that Meta survives regulation. It is that regulation keeps costing its smaller competitors more.
 Andrew Legget
Market Insights
Great earnings season, but are the earnings real?

At first glance, this was the strongest earnings season in years. But when you look at where the growth actually came from, the story splits into two very different pictures.
10
About TSE:6702
Fujitsu
Provides digital services in Japan, Europe, the United States, the Asia Pacific, East Asia, and internationally.
Flawless balance sheet with solid track record and pays a dividend.
Similar Companies
Market Insights


Advertisement
Weekly Picks
LO


Lou_Basenese on Oncolytics Biotech ·
The Team Behind a $2 Billion Johnson & Johnson (JNJ) Deal Just Took Over This $105 Million Cancer Biotech
Fair Value:US$3.575.5% undervalued
27 followersusers have followed this narrative
0 commentsusers have commented on this narrative
7 likesusers have liked this narrative
TR


tripledub on Meta Platforms ·
The $135 Billion Bet That Should Make Every Shareholder Nervous
Fair Value:US$5861.4% undervalued
59 followersusers have followed this narrative
3 commentsusers have commented on this narrative
34 likesusers have liked this narrative
TA


Talos on Voyager Technologies ·
The "Landlord of Orbit" – A Deep Value Play Ahead of the Starlab Era
Fair Value:US$385.291.1% undervalued
63 followersusers have followed this narrative
0 commentsusers have commented on this narrative
6 likesusers have liked this narrative
IV

Ivoed on Uber Technologies ·
Uber’s Valuation Depends On Who Captures The Economics Of Driverless Rides
Fair Value:US$11632.1% undervalued
12 followersusers have followed this narrative
0 commentsusers have commented on this narrative
3 likesusers have liked this narrative
Recently Updated Narratives
DA

dang on Resonance Health ·
Resonance Health will triple revenue growth to 30.83% in five years
Fair Value:AU$0.08331.3% undervalued
1 followerusers have followed this narrative
0 commentsusers have commented on this narrative
0 likesusers have liked this narrative
RO


RockeTeller on Santacruz Silver Mining ·
Santacruz Silver, 5.6M Oz Silver Producer Trading at Low Multiples, 100X Per-Share Upside in $200 Silver
Fair Value:CA$142.990.7% undervalued
96 followersusers have followed this narrative
14 commentsusers have commented on this narrative
0 likesusers have liked this narrative
CO


composite32 on Eaton ·
"Grid-to-Chip: How Eaton Controls the Physical Bottlenecks of AI Data Centers"
Fair Value:US$517.0622.1% undervalued
1 followerusers have followed this narrative
0 commentsusers have commented on this narrative
0 likesusers have liked this narrative
Popular Narratives
OS


oscargarcia on NVIDIA ·
The company that went from selling GPUs to gamers to becoming the AI arms dealer of the 21st century.
Fair Value:US$28022.3% undervalued
364 followersusers have followed this narrative
9 commentsusers have commented on this narrative
16 likesusers have liked this narrative
CU

CubanEros on Microsoft ·
A wonderful business at reasonable price.
Fair Value:US$419.9122.3% overvalued
213 followersusers have followed this narrative
0 commentsusers have commented on this narrative
9 likesusers have liked this narrative
KI

KiwiInvest on Amazon.com ·
Amazon's high growth, high tech segments propel its profits, while traditional segments plod along
Fair Value:US$475.0943.9% undervalued
240 followersusers have followed this narrative
1 commentusers have commented on this narrative
8 likesusers have liked this narrative


