T&S Group Inc.'s (TSE:4055) Business Is Yet to Catch Up With Its Share Price
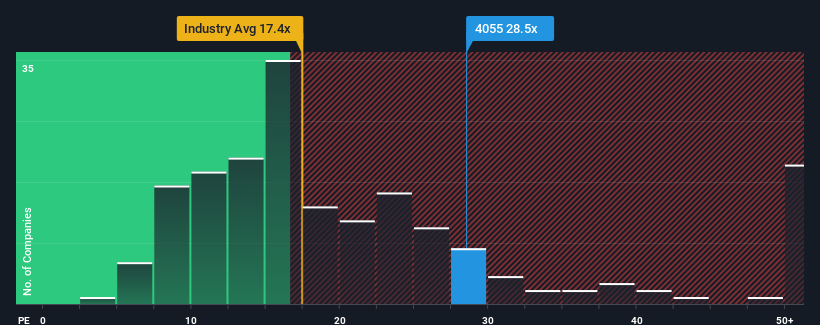
With a price-to-earnings (or "P/E") ratio of 28.5x T&S Group Inc. (TSE:4055) may be sending very bearish signals at the moment, given that almost half of all companies in Japan have P/E ratios under 13x and even P/E's lower than 9x are not unusual. Nonetheless, we'd need to dig a little deeper to determine if there is a rational basis for the highly elevated P/E.
With earnings growth that's inferior to most other companies of late, T&S Group has been relatively sluggish. It might be that many expect the uninspiring earnings performance to recover significantly, which has kept the P/E from collapsing. You'd really hope so, otherwise you're paying a pretty hefty price for no particular reason.
View our latest analysis for T&S Group

How Is T&S Group's Growth Trending?
There's an inherent assumption that a company should far outperform the market for P/E ratios like T&S Group's to be considered reasonable.
Retrospectively, the last year delivered virtually the same number to the company's bottom line as the year before. This isn't what shareholders were looking for as it means they've been left with a 6.1% decline in EPS over the last three years in total. Accordingly, shareholders would have felt downbeat about the medium-term rates of earnings growth.
Turning to the outlook, the next year should generate growth of 8.5% as estimated by the lone analyst watching the company. With the market predicted to deliver 10% growth , the company is positioned for a comparable earnings result.
In light of this, it's curious that T&S Group's P/E sits above the majority of other companies. It seems most investors are ignoring the fairly average growth expectations and are willing to pay up for exposure to the stock. Although, additional gains will be difficult to achieve as this level of earnings growth is likely to weigh down the share price eventually.
The Final Word
Generally, our preference is to limit the use of the price-to-earnings ratio to establishing what the market thinks about the overall health of a company.
Our examination of T&S Group's analyst forecasts revealed that its market-matching earnings outlook isn't impacting its high P/E as much as we would have predicted. When we see an average earnings outlook with market-like growth, we suspect the share price is at risk of declining, sending the high P/E lower. This places shareholders' investments at risk and potential investors in danger of paying an unnecessary premium.
Before you take the next step, you should know about the 2 warning signs for T&S Group that we have uncovered.
If you're unsure about the strength of T&S Group's business, why not explore our interactive list of stocks with solid business fundamentals for some other companies you may have missed.
Valuation is complex, but we're here to simplify it.
Discover if T&S Group might be undervalued or overvalued with our detailed analysis, featuring fair value estimates, potential risks, dividends, insider trades, and its financial condition.
Access Free AnalysisHave feedback on this article? Concerned about the content? Get in touch with us directly. Alternatively, email editorial-team (at) simplywallst.com.
This article by Simply Wall St is general in nature. We provide commentary based on historical data and analyst forecasts only using an unbiased methodology and our articles are not intended to be financial advice. It does not constitute a recommendation to buy or sell any stock, and does not take account of your objectives, or your financial situation. We aim to bring you long-term focused analysis driven by fundamental data. Note that our analysis may not factor in the latest price-sensitive company announcements or qualitative material. Simply Wall St has no position in any stocks mentioned.
About TSE:4055
T&S Group
Provides system development and operation/maintenance services in Japan.
Flawless balance sheet with solid track record.
Market Insights
Weekly Picks


Crazy Undervalued 42 Baggers Silver Play (Active & Running Mine)


Fiducian: Compliance Clouds or Value Opportunity?

Willamette Valley Vineyards (WVVI): Not-So-Great Value
Recently Updated Narratives

Moderation and Stabilisation: HOLD: Fair Price based on a 4-year Cycle is $12.08


Positioned globally, partnered locally


When will fraudsters be investigated in depth. Fraud was ongoing in France too.
Popular Narratives


MicroVision will explode future revenue by 380.37% with a vision towards success


NVDA: Expanding AI Demand Will Drive Major Data Center Investments Through 2026


