
Advertisement
I'LL inc.'s (TSE:3854) robust earnings report didn't manage to move the market for its stock. We did some digging, and we found some concerning factors in the details.
Check out our latest analysis for I'LL
Examining Cashflow Against I'LL's Earnings
Many investors haven't heard of the accrual ratio from cashflow, but it is actually a useful measure of how well a company's profit is backed up by free cash flow (FCF) during a given period. The accrual ratio subtracts the FCF from the profit for a given period, and divides the result by the average operating assets of the company over that time. This ratio tells us how much of a company's profit is not backed by free cashflow.
Therefore, it's actually considered a good thing when a company has a negative accrual ratio, but a bad thing if its accrual ratio is positive. While it's not a problem to have a positive accrual ratio, indicating a certain level of non-cash profits, a high accrual ratio is arguably a bad thing, because it indicates paper profits are not matched by cash flow. To quote a 2014 paper by Lewellen and Resutek, "firms with higher accruals tend to be less profitable in the future".
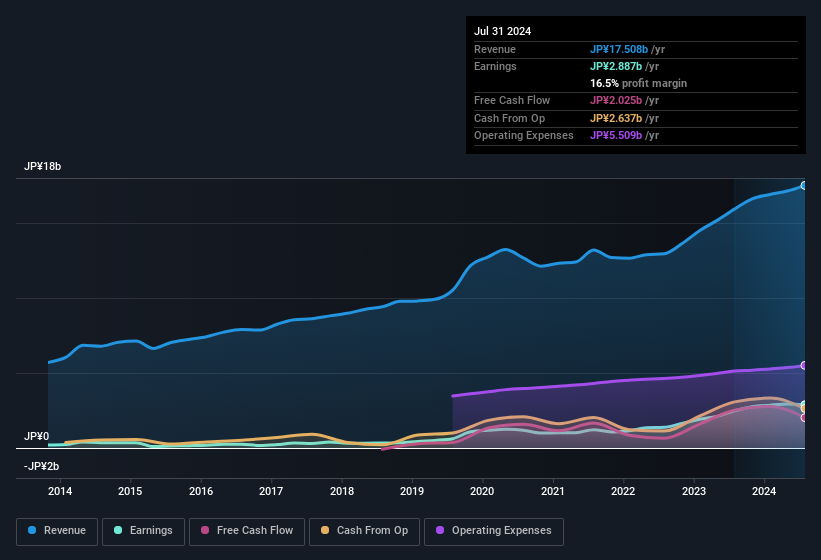
Over the twelve months to July 2024, I'LL recorded an accrual ratio of 0.34. We can therefore deduce that its free cash flow fell well short of covering its statutory profit, suggesting we might want to think twice before putting a lot of weight on the latter. To wit, it produced free cash flow of JP¥2.0b during the period, falling well short of its reported profit of JP¥2.89b. I'LL shareholders will no doubt be hoping that its free cash flow bounces back next year, since it was down over the last twelve months. One positive for I'LL shareholders is that it's accrual ratio was significantly better last year, providing reason to believe that it may return to stronger cash conversion in the future. As a result, some shareholders may be looking for stronger cash conversion in the current year.
That might leave you wondering what analysts are forecasting in terms of future profitability. Luckily, you can click here to see an interactive graph depicting future profitability, based on their estimates.
Our Take On I'LL's Profit Performance
As we have made quite clear, we're a bit worried that I'LL didn't back up the last year's profit with free cashflow. As a result, we think it may well be the case that I'LL's underlying earnings power is lower than its statutory profit. But on the bright side, its earnings per share have grown at an extremely impressive rate over the last three years. Of course, we've only just scratched the surface when it comes to analysing its earnings; one could also consider margins, forecast growth, and return on investment, among other factors. With this in mind, we wouldn't consider investing in a stock unless we had a thorough understanding of the risks. Case in point: We've spotted 1 warning sign for I'LL you should be aware of.
Today we've zoomed in on a single data point to better understand the nature of I'LL's profit. But there are plenty of other ways to inform your opinion of a company. For example, many people consider a high return on equity as an indication of favorable business economics, while others like to 'follow the money' and search out stocks that insiders are buying. So you may wish to see this free collection of companies boasting high return on equity, or this list of stocks with high insider ownership.
New: AI Stock Screener & Alerts
Our new AI Stock Screener scans the market every day to uncover opportunities.
• Dividend Powerhouses (3%+ Yield)
• Undervalued Small Caps with Insider Buying
• High growth Tech and AI Companies
Or build your own from over 50 metrics.
Have feedback on this article? Concerned about the content? Get in touch with us directly. Alternatively, email editorial-team (at) simplywallst.com.
This article by Simply Wall St is general in nature. We provide commentary based on historical data and analyst forecasts only using an unbiased methodology and our articles are not intended to be financial advice. It does not constitute a recommendation to buy or sell any stock, and does not take account of your objectives, or your financial situation. We aim to bring you long-term focused analysis driven by fundamental data. Note that our analysis may not factor in the latest price-sensitive company announcements or qualitative material. Simply Wall St has no position in any stocks mentioned.
About TSE:3854
Flawless balance sheet with solid track record and pays a dividend.
Market Insights

Advertisement
Community Narratives
Kodiak AI - a potential 100 bagger opportunity?
Fair Value US$14.00|44.7% undervalued
DA
Community Contributor
A Fair Price for a Great Business Facing Real Threats
Fair Value US$383.06|13.0% undervalued
IM
Community Contributor
AXON And Shopify Integration Will Unlock Global Mobile Advertising
Fair Value US$646.30|0% overvalued
AN
Based on Analyst Price Targets