Could The Market Be Wrong About eBASE Co.,Ltd. (TSE:3835) Given Its Attractive Financial Prospects?


With its stock down 19% over the past three months, it is easy to disregard eBASELtd (TSE:3835). However, stock prices are usually driven by a company’s financial performance over the long term, which in this case looks quite promising. In this article, we decided to focus on eBASELtd's ROE.
Return on Equity or ROE is a test of how effectively a company is growing its value and managing investors’ money. Put another way, it reveals the company's success at turning shareholder investments into profits.
We've discovered 1 warning sign about eBASELtd. View them for free.How Do You Calculate Return On Equity?
The formula for ROE is:
Return on Equity = Net Profit (from continuing operations) ÷ Shareholders' Equity
So, based on the above formula, the ROE for eBASELtd is:
16% = JP¥1.1b ÷ JP¥6.9b (Based on the trailing twelve months to December 2024).
The 'return' is the income the business earned over the last year. One way to conceptualize this is that for each ¥1 of shareholders' capital it has, the company made ¥0.16 in profit.
See our latest analysis for eBASELtd
Why Is ROE Important For Earnings Growth?
Thus far, we have learned that ROE measures how efficiently a company is generating its profits. Depending on how much of these profits the company reinvests or "retains", and how effectively it does so, we are then able to assess a company’s earnings growth potential. Assuming everything else remains unchanged, the higher the ROE and profit retention, the higher the growth rate of a company compared to companies that don't necessarily bear these characteristics.
A Side By Side comparison of eBASELtd's Earnings Growth And 16% ROE
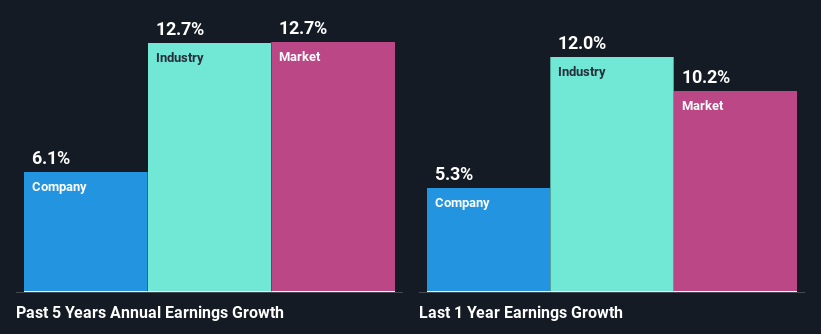
To start with, eBASELtd's ROE looks acceptable. Even when compared to the industry average of 14% the company's ROE looks quite decent. This certainly adds some context to eBASELtd's moderate 6.1% net income growth seen over the past five years.
As a next step, we compared eBASELtd's net income growth with the industry and were disappointed to see that the company's growth is lower than the industry average growth of 13% in the same period.
Earnings growth is a huge factor in stock valuation. It’s important for an investor to know whether the market has priced in the company's expected earnings growth (or decline). By doing so, they will have an idea if the stock is headed into clear blue waters or if swampy waters await. If you're wondering about eBASELtd's's valuation, check out this gauge of its price-to-earnings ratio, as compared to its industry.
Is eBASELtd Using Its Retained Earnings Effectively?
eBASELtd has a healthy combination of a moderate three-year median payout ratio of 34% (or a retention ratio of 66%) and a respectable amount of growth in earnings as we saw above, meaning that the company has been making efficient use of its profits.
Moreover, eBASELtd is determined to keep sharing its profits with shareholders which we infer from its long history of paying a dividend for at least ten years.
Summary
Overall, we are quite pleased with eBASELtd's performance. Particularly, we like that the company is reinvesting heavily into its business, and at a high rate of return. As a result, the decent growth in its earnings is not surprising. If the company continues to grow its earnings the way it has, that could have a positive impact on its share price given how earnings per share influence long-term share prices. Let's not forget, business risk is also one of the factors that affects the price of the stock. So this is also an important area that investors need to pay attention to before making a decision on any business. To know the 1 risk we have identified for eBASELtd visit our risks dashboard for free.
New: Manage All Your Stock Portfolios in One Place
We've created the ultimate portfolio companion for stock investors, and it's free.
• Connect an unlimited number of Portfolios and see your total in one currency
• Be alerted to new Warning Signs or Risks via email or mobile
• Track the Fair Value of your stocks
Have feedback on this article? Concerned about the content? Get in touch with us directly. Alternatively, email editorial-team (at) simplywallst.com.
This article by Simply Wall St is general in nature. We provide commentary based on historical data and analyst forecasts only using an unbiased methodology and our articles are not intended to be financial advice. It does not constitute a recommendation to buy or sell any stock, and does not take account of your objectives, or your financial situation. We aim to bring you long-term focused analysis driven by fundamental data. Note that our analysis may not factor in the latest price-sensitive company announcements or qualitative material. Simply Wall St has no position in any stocks mentioned.
About TSE:3835
eBASELtd
eBase Co.,Ltd. engages in the planning, development, sale, and maintenance of content management software in Japan.
Flawless balance sheet average dividend payer.
Market Insights

Community Narratives

