
Advertisement

Legendary fund manager Li Lu (who Charlie Munger backed) once said, 'The biggest investment risk is not the volatility of prices, but whether you will suffer a permanent loss of capital.' So it seems the smart money knows that debt - which is usually involved in bankruptcies - is a very important factor, when you assess how risky a company is. We can see that TIS Inc. (TSE:3626) does use debt in its business. But the real question is whether this debt is making the company risky.
When Is Debt Dangerous?
Debt and other liabilities become risky for a business when it cannot easily fulfill those obligations, either with free cash flow or by raising capital at an attractive price. Ultimately, if the company can't fulfill its legal obligations to repay debt, shareholders could walk away with nothing. However, a more usual (but still expensive) situation is where a company must dilute shareholders at a cheap share price simply to get debt under control. Of course, the upside of debt is that it often represents cheap capital, especially when it replaces dilution in a company with the ability to reinvest at high rates of return. The first step when considering a company's debt levels is to consider its cash and debt together.
See our latest analysis for TIS
What Is TIS's Net Debt?
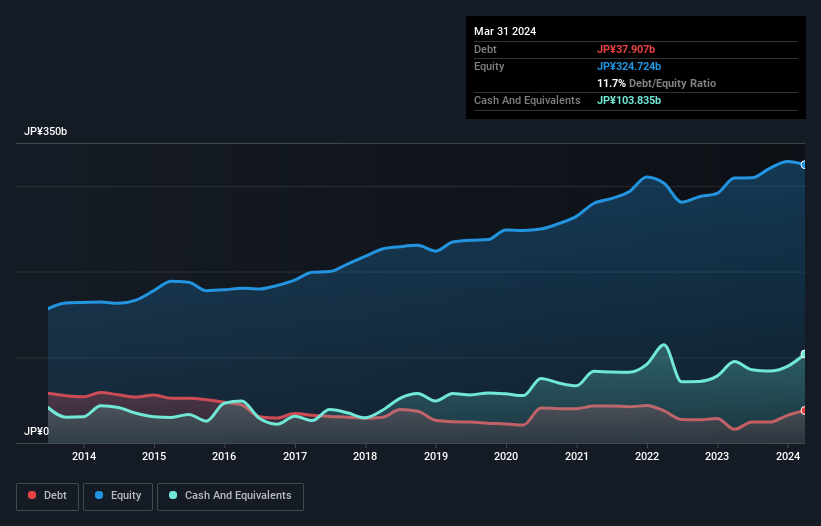
The image below, which you can click on for greater detail, shows that at March 2024 TIS had debt of JP¥37.9b, up from JP¥16.0b in one year. However, it does have JP¥103.8b in cash offsetting this, leading to net cash of JP¥65.9b.
A Look At TIS' Liabilities
According to the last reported balance sheet, TIS had liabilities of JP¥140.3b due within 12 months, and liabilities of JP¥60.5b due beyond 12 months. Offsetting these obligations, it had cash of JP¥103.8b as well as receivables valued at JP¥148.1b due within 12 months. So it actually has JP¥51.2b more liquid assets than total liabilities.
This short term liquidity is a sign that TIS could probably pay off its debt with ease, as its balance sheet is far from stretched. Simply put, the fact that TIS has more cash than debt is arguably a good indication that it can manage its debt safely.
Fortunately, TIS grew its EBIT by 7.6% in the last year, making that debt load look even more manageable. When analysing debt levels, the balance sheet is the obvious place to start. But it is future earnings, more than anything, that will determine TIS's ability to maintain a healthy balance sheet going forward. So if you're focused on the future you can check out this free report showing analyst profit forecasts.
Finally, a business needs free cash flow to pay off debt; accounting profits just don't cut it. While TIS has net cash on its balance sheet, it's still worth taking a look at its ability to convert earnings before interest and tax (EBIT) to free cash flow, to help us understand how quickly it is building (or eroding) that cash balance. Over the most recent three years, TIS recorded free cash flow worth 59% of its EBIT, which is around normal, given free cash flow excludes interest and tax. This cold hard cash means it can reduce its debt when it wants to.
Summing Up
While we empathize with investors who find debt concerning, you should keep in mind that TIS has net cash of JP¥65.9b, as well as more liquid assets than liabilities. So we don't think TIS's use of debt is risky. Above most other metrics, we think its important to track how fast earnings per share is growing, if at all. If you've also come to that realization, you're in luck, because today you can view this interactive graph of TIS's earnings per share history for free.
At the end of the day, it's often better to focus on companies that are free from net debt. You can access our special list of such companies (all with a track record of profit growth). It's free.
Valuation is complex, but we're here to simplify it.
Discover if TIS might be undervalued or overvalued with our detailed analysis, featuring fair value estimates, potential risks, dividends, insider trades, and its financial condition.
Access Free AnalysisHave feedback on this article? Concerned about the content? Get in touch with us directly. Alternatively, email editorial-team (at) simplywallst.com.
This article by Simply Wall St is general in nature. We provide commentary based on historical data and analyst forecasts only using an unbiased methodology and our articles are not intended to be financial advice. It does not constitute a recommendation to buy or sell any stock, and does not take account of your objectives, or your financial situation. We aim to bring you long-term focused analysis driven by fundamental data. Note that our analysis may not factor in the latest price-sensitive company announcements or qualitative material. Simply Wall St has no position in any stocks mentioned.
About TSE:3626
TIS
Provides information technology (IT) services in Japan and internationally.
Excellent balance sheet average dividend payer.
Similar Companies
Market Insights

Advertisement
Community Narratives
Pinterest will surge as advertising innovations ignite revenue growth
Fair Value US$42.63|27.0% undervalued
BR
Community Contributor
Brambles' Revenue Set to Climb 14% with Profit Margins Following
Fair Value AU$21.90|5.9% overvalued
RO
Community Contributor
Challenging Future for STG as Organic Sales Decline by 8.8%
Fair Value DKK 116.13|26.8% undervalued
KA
Community Contributor