- Japan
- /
- Semiconductors
- /
- TSE:6525
Kokusai Electric Corporation (TSE:6525) Shares Could Be 28% Above Their Intrinsic Value Estimate


Key Insights
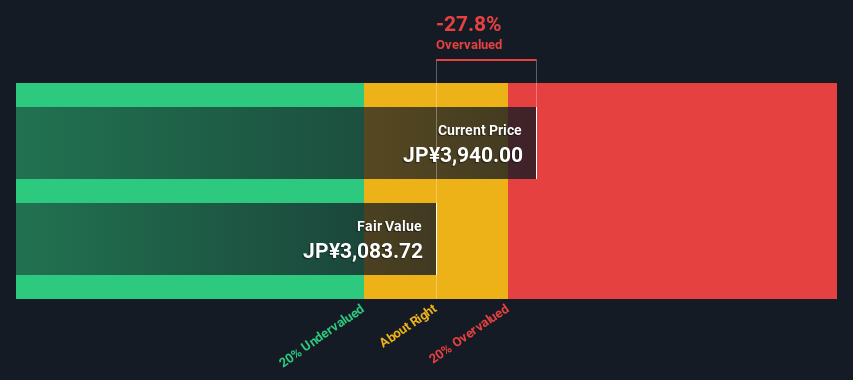
- The projected fair value for Kokusai Electric is JP¥3,084 based on 2 Stage Free Cash Flow to Equity
- Kokusai Electric is estimated to be 28% overvalued based on current share price of JP¥3,940
- Our fair value estimate is 38% lower than Kokusai Electric's analyst price target of JP¥4,939
Does the April share price for Kokusai Electric Corporation (TSE:6525) reflect what it's really worth? Today, we will estimate the stock's intrinsic value by taking the forecast future cash flows of the company and discounting them back to today's value. We will use the Discounted Cash Flow (DCF) model on this occasion. It may sound complicated, but actually it is quite simple!
We generally believe that a company's value is the present value of all of the cash it will generate in the future. However, a DCF is just one valuation metric among many, and it is not without flaws. For those who are keen learners of equity analysis, the Simply Wall St analysis model here may be something of interest to you.
View our latest analysis for Kokusai Electric
Crunching The Numbers
We are going to use a two-stage DCF model, which, as the name states, takes into account two stages of growth. The first stage is generally a higher growth period which levels off heading towards the terminal value, captured in the second 'steady growth' period. To start off with, we need to estimate the next ten years of cash flows. Where possible we use analyst estimates, but when these aren't available we extrapolate the previous free cash flow (FCF) from the last estimate or reported value. We assume companies with shrinking free cash flow will slow their rate of shrinkage, and that companies with growing free cash flow will see their growth rate slow, over this period. We do this to reflect that growth tends to slow more in the early years than it does in later years.
Generally we assume that a dollar today is more valuable than a dollar in the future, so we need to discount the sum of these future cash flows to arrive at a present value estimate:
10-year free cash flow (FCF) forecast
| 2024 | 2025 | 2026 | 2027 | 2028 | 2029 | 2030 | 2031 | 2032 | 2033 | |
| Levered FCF (¥, Millions) | -JP¥1.96b | JP¥12.4b | JP¥44.1b | JP¥62.0b | JP¥64.0b | JP¥65.4b | JP¥66.4b | JP¥67.1b | JP¥67.6b | JP¥68.1b |
| Growth Rate Estimate Source | Analyst x4 | Analyst x3 | Analyst x4 | Analyst x2 | Analyst x2 | Est @ 2.08% | Est @ 1.51% | Est @ 1.10% | Est @ 0.82% | Est @ 0.62% |
| Present Value (¥, Millions) Discounted @ 8.0% | -JP¥1.8k | JP¥10.6k | JP¥35.0k | JP¥45.6k | JP¥43.6k | JP¥41.2k | JP¥38.7k | JP¥36.3k | JP¥33.9k | JP¥31.6k |
("Est" = FCF growth rate estimated by Simply Wall St)
Present Value of 10-year Cash Flow (PVCF) = JP¥315b
We now need to calculate the Terminal Value, which accounts for all the future cash flows after this ten year period. The Gordon Growth formula is used to calculate Terminal Value at a future annual growth rate equal to the 5-year average of the 10-year government bond yield of 0.2%. We discount the terminal cash flows to today's value at a cost of equity of 8.0%.
Terminal Value (TV)= FCF2033 × (1 + g) ÷ (r – g) = JP¥68b× (1 + 0.2%) ÷ (8.0%– 0.2%) = JP¥871b
Present Value of Terminal Value (PVTV)= TV / (1 + r)10= JP¥871b÷ ( 1 + 8.0%)10= JP¥404b
The total value, or equity value, is then the sum of the present value of the future cash flows, which in this case is JP¥718b. In the final step we divide the equity value by the number of shares outstanding. Relative to the current share price of JP¥3.9k, the company appears slightly overvalued at the time of writing. The assumptions in any calculation have a big impact on the valuation, so it is better to view this as a rough estimate, not precise down to the last cent.
The Assumptions
We would point out that the most important inputs to a discounted cash flow are the discount rate and of course the actual cash flows. Part of investing is coming up with your own evaluation of a company's future performance, so try the calculation yourself and check your own assumptions. The DCF also does not consider the possible cyclicality of an industry, or a company's future capital requirements, so it does not give a full picture of a company's potential performance. Given that we are looking at Kokusai Electric as potential shareholders, the cost of equity is used as the discount rate, rather than the cost of capital (or weighted average cost of capital, WACC) which accounts for debt. In this calculation we've used 8.0%, which is based on a levered beta of 1.391. Beta is a measure of a stock's volatility, compared to the market as a whole. We get our beta from the industry average beta of globally comparable companies, with an imposed limit between 0.8 and 2.0, which is a reasonable range for a stable business.
SWOT Analysis for Kokusai Electric
- Debt is well covered by earnings.
- Earnings declined over the past year.
- Dividend is low compared to the top 25% of dividend payers in the Semiconductor market.
- Annual earnings are forecast to grow faster than the Japanese market.
- Good value based on P/E ratio compared to estimated Fair P/E ratio.
- Revenue is forecast to grow slower than 20% per year.
Looking Ahead:
Whilst important, the DCF calculation ideally won't be the sole piece of analysis you scrutinize for a company. The DCF model is not a perfect stock valuation tool. Preferably you'd apply different cases and assumptions and see how they would impact the company's valuation. For instance, if the terminal value growth rate is adjusted slightly, it can dramatically alter the overall result. Why is the intrinsic value lower than the current share price? For Kokusai Electric, we've compiled three pertinent factors you should further examine:
- Risks: Take risks, for example - Kokusai Electric has 1 warning sign we think you should be aware of.
- Future Earnings: How does 6525's growth rate compare to its peers and the wider market? Dig deeper into the analyst consensus number for the upcoming years by interacting with our free analyst growth expectation chart.
- Other High Quality Alternatives: Do you like a good all-rounder? Explore our interactive list of high quality stocks to get an idea of what else is out there you may be missing!
PS. Simply Wall St updates its DCF calculation for every Japanese stock every day, so if you want to find the intrinsic value of any other stock just search here.
If you're looking to trade Kokusai Electric, open an account with the lowest-cost platform trusted by professionals, Interactive Brokers.
With clients in over 200 countries and territories, and access to 160 markets, IBKR lets you trade stocks, options, futures, forex, bonds and funds from a single integrated account.
Enjoy no hidden fees, no account minimums, and FX conversion rates as low as 0.03%, far better than what most brokers offer.
Sponsored ContentValuation is complex, but we're here to simplify it.
Discover if Kokusai Electric might be undervalued or overvalued with our detailed analysis, featuring fair value estimates, potential risks, dividends, insider trades, and its financial condition.
Access Free AnalysisHave feedback on this article? Concerned about the content? Get in touch with us directly. Alternatively, email editorial-team (at) simplywallst.com.
This article by Simply Wall St is general in nature. We provide commentary based on historical data and analyst forecasts only using an unbiased methodology and our articles are not intended to be financial advice. It does not constitute a recommendation to buy or sell any stock, and does not take account of your objectives, or your financial situation. We aim to bring you long-term focused analysis driven by fundamental data. Note that our analysis may not factor in the latest price-sensitive company announcements or qualitative material. Simply Wall St has no position in any stocks mentioned.
About TSE:6525
Kokusai Electric
Engages in the development, manufacture, sale, repair, and maintenance of semiconductor manufacturing equipment worldwide.
Excellent balance sheet with reasonable growth potential.

