
Advertisement
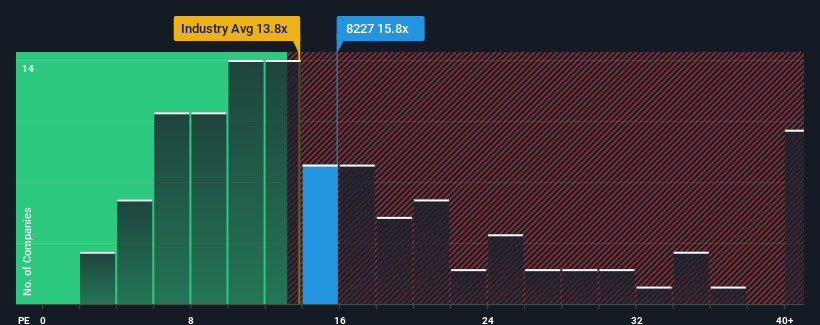
When close to half the companies in Japan have price-to-earnings ratios (or "P/E's") below 13x, you may consider SHIMAMURA Co., Ltd. (TSE:8227) as a stock to potentially avoid with its 15.8x P/E ratio. Although, it's not wise to just take the P/E at face value as there may be an explanation why it's as high as it is.
With earnings growth that's inferior to most other companies of late, SHIMAMURA has been relatively sluggish. It might be that many expect the uninspiring earnings performance to recover significantly, which has kept the P/E from collapsing. You'd really hope so, otherwise you're paying a pretty hefty price for no particular reason.
Check out our latest analysis for SHIMAMURA
What Are Growth Metrics Telling Us About The High P/E?
There's an inherent assumption that a company should outperform the market for P/E ratios like SHIMAMURA's to be considered reasonable.
If we review the last year of earnings growth, the company posted a worthy increase of 3.2%. The solid recent performance means it was also able to grow EPS by 29% in total over the last three years. So we can start by confirming that the company has actually done a good job of growing earnings over that time.
Shifting to the future, estimates from the twelve analysts covering the company suggest earnings should grow by 5.0% per annum over the next three years. That's shaping up to be materially lower than the 9.9% per annum growth forecast for the broader market.
With this information, we find it concerning that SHIMAMURA is trading at a P/E higher than the market. It seems most investors are hoping for a turnaround in the company's business prospects, but the analyst cohort is not so confident this will happen. There's a good chance these shareholders are setting themselves up for future disappointment if the P/E falls to levels more in line with the growth outlook.
The Bottom Line On SHIMAMURA's P/E
While the price-to-earnings ratio shouldn't be the defining factor in whether you buy a stock or not, it's quite a capable barometer of earnings expectations.
We've established that SHIMAMURA currently trades on a much higher than expected P/E since its forecast growth is lower than the wider market. When we see a weak earnings outlook with slower than market growth, we suspect the share price is at risk of declining, sending the high P/E lower. Unless these conditions improve markedly, it's very challenging to accept these prices as being reasonable.
Having said that, be aware SHIMAMURA is showing 1 warning sign in our investment analysis, you should know about.
If you're unsure about the strength of SHIMAMURA's business, why not explore our interactive list of stocks with solid business fundamentals for some other companies you may have missed.
New: Manage All Your Stock Portfolios in One Place
We've created the ultimate portfolio companion for stock investors, and it's free.
• Connect an unlimited number of Portfolios and see your total in one currency
• Be alerted to new Warning Signs or Risks via email or mobile
• Track the Fair Value of your stocks
Have feedback on this article? Concerned about the content? Get in touch with us directly. Alternatively, email editorial-team (at) simplywallst.com.
This article by Simply Wall St is general in nature. We provide commentary based on historical data and analyst forecasts only using an unbiased methodology and our articles are not intended to be financial advice. It does not constitute a recommendation to buy or sell any stock, and does not take account of your objectives, or your financial situation. We aim to bring you long-term focused analysis driven by fundamental data. Note that our analysis may not factor in the latest price-sensitive company announcements or qualitative material. Simply Wall St has no position in any stocks mentioned.
About TSE:8227
SHIMAMURA
Engages in the sale of clothing and fashion related products in Japan and Taiwan.
Flawless balance sheet average dividend payer.
Similar Companies
Market Insights

Advertisement
Community Narratives
A formidable player in AI and enterprise computing.
Fair Value US$210.00|12.2% overvalued
CO
Community Contributor
IREN's Bold Moves in Sustainable Bitcoin Mining & AI Data Centers
Fair Value US$72.52|17.1% undervalued
BL
Community Contributor
Cooling the Champions: The Aussie Tech Behind F1's Victories
Fair Value AU$12.40|38.7% undervalued
TR
Community Contributor