- Japan
- /
- Retail Distributors
- /
- TSE:4935
Liberta Co.,Ltd. (TSE:4935) Looks Just Right With A 26% Price Jump


Those holding Liberta Co.,Ltd. (TSE:4935) shares would be relieved that the share price has rebounded 26% in the last thirty days, but it needs to keep going to repair the recent damage it has caused to investor portfolios. The last month tops off a massive increase of 270% in the last year.
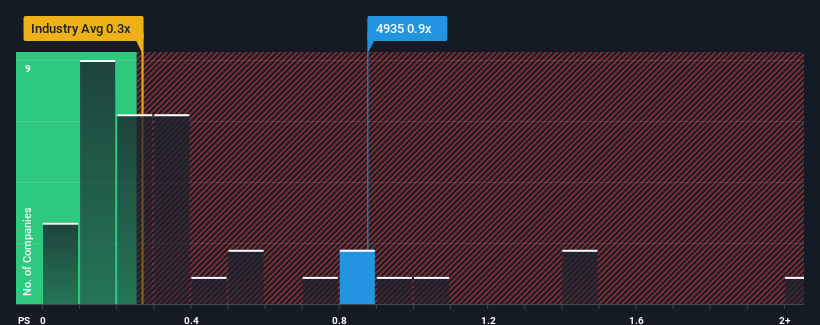
Since its price has surged higher, when almost half of the companies in Japan's Retail Distributors industry have price-to-sales ratios (or "P/S") below 0.3x, you may consider LibertaLtd as a stock probably not worth researching with its 0.9x P/S ratio. However, the P/S might be high for a reason and it requires further investigation to determine if it's justified.
View our latest analysis for LibertaLtd
How LibertaLtd Has Been Performing
Revenue has risen firmly for LibertaLtd recently, which is pleasing to see. Perhaps the market is expecting this decent revenue performance to beat out the industry over the near term, which has kept the P/S propped up. You'd really hope so, otherwise you're paying a pretty hefty price for no particular reason.
Although there are no analyst estimates available for LibertaLtd, take a look at this free data-rich visualisation to see how the company stacks up on earnings, revenue and cash flow.Is There Enough Revenue Growth Forecasted For LibertaLtd?
There's an inherent assumption that a company should outperform the industry for P/S ratios like LibertaLtd's to be considered reasonable.
Retrospectively, the last year delivered an exceptional 22% gain to the company's top line. The latest three year period has also seen an excellent 72% overall rise in revenue, aided by its short-term performance. Accordingly, shareholders would have definitely welcomed those medium-term rates of revenue growth.
When compared to the industry's one-year growth forecast of 4.9%, the most recent medium-term revenue trajectory is noticeably more alluring
With this information, we can see why LibertaLtd is trading at such a high P/S compared to the industry. Presumably shareholders aren't keen to offload something they believe will continue to outmanoeuvre the wider industry.
What We Can Learn From LibertaLtd's P/S?
The large bounce in LibertaLtd's shares has lifted the company's P/S handsomely. Generally, our preference is to limit the use of the price-to-sales ratio to establishing what the market thinks about the overall health of a company.
As we suspected, our examination of LibertaLtd revealed its three-year revenue trends are contributing to its high P/S, given they look better than current industry expectations. Right now shareholders are comfortable with the P/S as they are quite confident revenue aren't under threat. If recent medium-term revenue trends continue, it's hard to see the share price falling strongly in the near future under these circumstances.
Before you settle on your opinion, we've discovered 4 warning signs for LibertaLtd (3 shouldn't be ignored!) that you should be aware of.
Of course, profitable companies with a history of great earnings growth are generally safer bets. So you may wish to see this free collection of other companies that have reasonable P/E ratios and have grown earnings strongly.
If you're looking to trade LibertaLtd, open an account with the lowest-cost platform trusted by professionals, Interactive Brokers.
With clients in over 200 countries and territories, and access to 160 markets, IBKR lets you trade stocks, options, futures, forex, bonds and funds from a single integrated account.
Enjoy no hidden fees, no account minimums, and FX conversion rates as low as 0.03%, far better than what most brokers offer.
Sponsored ContentNew: AI Stock Screener & Alerts
Our new AI Stock Screener scans the market every day to uncover opportunities.
• Dividend Powerhouses (3%+ Yield)
• Undervalued Small Caps with Insider Buying
• High growth Tech and AI Companies
Or build your own from over 50 metrics.
Have feedback on this article? Concerned about the content? Get in touch with us directly. Alternatively, email editorial-team (at) simplywallst.com.
This article by Simply Wall St is general in nature. We provide commentary based on historical data and analyst forecasts only using an unbiased methodology and our articles are not intended to be financial advice. It does not constitute a recommendation to buy or sell any stock, and does not take account of your objectives, or your financial situation. We aim to bring you long-term focused analysis driven by fundamental data. Note that our analysis may not factor in the latest price-sensitive company announcements or qualitative material. Simply Wall St has no position in any stocks mentioned.
About TSE:4935
LibertaLtd
Engages in the planning and sale of beauty products, household and daily miscellaneous goods, and functional clothing products in Japan and internationally.
Slight with imperfect balance sheet.
Market Insights

Community Narratives

