Mercari's (TSE:4385) Returns On Capital Are Heading Higher


There are a few key trends to look for if we want to identify the next multi-bagger. Typically, we'll want to notice a trend of growing return on capital employed (ROCE) and alongside that, an expanding base of capital employed. If you see this, it typically means it's a company with a great business model and plenty of profitable reinvestment opportunities. Speaking of which, we noticed some great changes in Mercari's (TSE:4385) returns on capital, so let's have a look.
Understanding Return On Capital Employed (ROCE)
For those that aren't sure what ROCE is, it measures the amount of pre-tax profits a company can generate from the capital employed in its business. The formula for this calculation on Mercari is:
Return on Capital Employed = Earnings Before Interest and Tax (EBIT) ÷ (Total Assets - Current Liabilities)
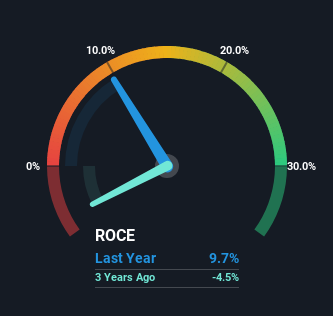
0.097 = JP¥19b ÷ (JP¥457b - JP¥261b) (Based on the trailing twelve months to December 2023).
Therefore, Mercari has an ROCE of 9.7%. On its own that's a low return on capital but it's in line with the industry's average returns of 9.7%.
Check out our latest analysis for Mercari
Above you can see how the current ROCE for Mercari compares to its prior returns on capital, but there's only so much you can tell from the past. If you'd like, you can check out the forecasts from the analysts covering Mercari for free.
What Does the ROCE Trend For Mercari Tell Us?
We're delighted to see that Mercari is reaping rewards from its investments and is now generating some pre-tax profits. The company was generating losses five years ago, but now it's earning 9.7% which is a sight for sore eyes. And unsurprisingly, like most companies trying to break into the black, Mercari is utilizing 173% more capital than it was five years ago. We like this trend, because it tells us the company has profitable reinvestment opportunities available to it, and if it continues going forward that can lead to a multi-bagger performance.
For the record though, there was a noticeable increase in the company's current liabilities over the period, so we would attribute some of the ROCE growth to that. Essentially the business now has suppliers or short-term creditors funding about 57% of its operations, which isn't ideal. And with current liabilities at those levels, that's pretty high.
The Key Takeaway
To the delight of most shareholders, Mercari has now broken into profitability. Given the stock has declined 36% in the last five years, this could be a good investment if the valuation and other metrics are also appealing. So researching this company further and determining whether or not these trends will continue seems justified.
Before jumping to any conclusions though, we need to know what value we're getting for the current share price. That's where you can check out our FREE intrinsic value estimation for 4385 that compares the share price and estimated value.
If you want to search for solid companies with great earnings, check out this free list of companies with good balance sheets and impressive returns on equity.
If you're looking to trade Mercari, open an account with the lowest-cost platform trusted by professionals, Interactive Brokers.
With clients in over 200 countries and territories, and access to 160 markets, IBKR lets you trade stocks, options, futures, forex, bonds and funds from a single integrated account.
Enjoy no hidden fees, no account minimums, and FX conversion rates as low as 0.03%, far better than what most brokers offer.
Sponsored ContentNew: Manage All Your Stock Portfolios in One Place
We've created the ultimate portfolio companion for stock investors, and it's free.
• Connect an unlimited number of Portfolios and see your total in one currency
• Be alerted to new Warning Signs or Risks via email or mobile
• Track the Fair Value of your stocks
Have feedback on this article? Concerned about the content? Get in touch with us directly. Alternatively, email editorial-team (at) simplywallst.com.
This article by Simply Wall St is general in nature. We provide commentary based on historical data and analyst forecasts only using an unbiased methodology and our articles are not intended to be financial advice. It does not constitute a recommendation to buy or sell any stock, and does not take account of your objectives, or your financial situation. We aim to bring you long-term focused analysis driven by fundamental data. Note that our analysis may not factor in the latest price-sensitive company announcements or qualitative material. Simply Wall St has no position in any stocks mentioned.
About TSE:4385
Mercari
Plans, develops, and operates Mercari marketplace applications in Japan and the United States.
Adequate balance sheet with moderate growth potential.
Similar Companies
Market Insights

Community Narratives

