J. Front Retailing Co., Ltd.'s (TSE:3086) Fundamentals Look Pretty Strong: Could The Market Be Wrong About The Stock?

It is hard to get excited after looking at J. Front Retailing's (TSE:3086) recent performance, when its stock has declined 14% over the past three months. However, a closer look at its sound financials might cause you to think again. Given that fundamentals usually drive long-term market outcomes, the company is worth looking at. Particularly, we will be paying attention to J. Front Retailing's ROE today.
Return on equity or ROE is an important factor to be considered by a shareholder because it tells them how effectively their capital is being reinvested. In other words, it is a profitability ratio which measures the rate of return on the capital provided by the company's shareholders.
Check out our latest analysis for J. Front Retailing
How To Calculate Return On Equity?
ROE can be calculated by using the formula:
Return on Equity = Net Profit (from continuing operations) ÷ Shareholders' Equity
So, based on the above formula, the ROE for J. Front Retailing is:
11% = JP¥46b ÷ JP¥409b (Based on the trailing twelve months to August 2024).
The 'return' is the profit over the last twelve months. Another way to think of that is that for every ¥1 worth of equity, the company was able to earn ¥0.11 in profit.
What Has ROE Got To Do With Earnings Growth?
We have already established that ROE serves as an efficient profit-generating gauge for a company's future earnings. We now need to evaluate how much profit the company reinvests or "retains" for future growth which then gives us an idea about the growth potential of the company. Generally speaking, other things being equal, firms with a high return on equity and profit retention, have a higher growth rate than firms that don’t share these attributes.
J. Front Retailing's Earnings Growth And 11% ROE
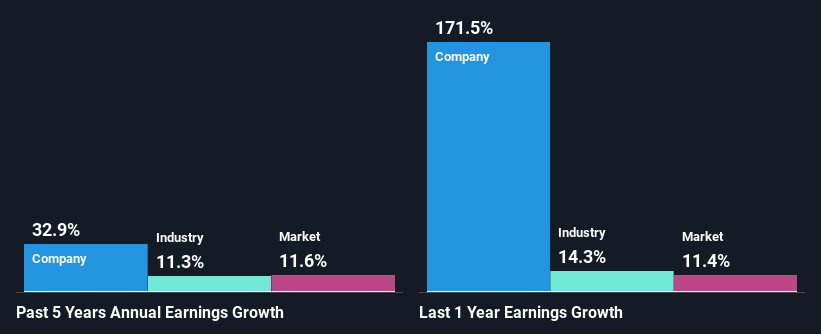
To start with, J. Front Retailing's ROE looks acceptable. And on comparing with the industry, we found that the the average industry ROE is similar at 10%. Consequently, this likely laid the ground for the impressive net income growth of 33% seen over the past five years by J. Front Retailing. We reckon that there could also be other factors at play here. For example, it is possible that the company's management has made some good strategic decisions, or that the company has a low payout ratio.
Next, on comparing with the industry net income growth, we found that J. Front Retailing's growth is quite high when compared to the industry average growth of 11% in the same period, which is great to see.
The basis for attaching value to a company is, to a great extent, tied to its earnings growth. What investors need to determine next is if the expected earnings growth, or the lack of it, is already built into the share price. By doing so, they will have an idea if the stock is headed into clear blue waters or if swampy waters await. What is 3086 worth today? The intrinsic value infographic in our free research report helps visualize whether 3086 is currently mispriced by the market.
Is J. Front Retailing Using Its Retained Earnings Effectively?
The three-year median payout ratio for J. Front Retailing is 40%, which is moderately low. The company is retaining the remaining 60%. This suggests that its dividend is well covered, and given the high growth we discussed above, it looks like J. Front Retailing is reinvesting its earnings efficiently.
Besides, J. Front Retailing has been paying dividends for at least ten years or more. This shows that the company is committed to sharing profits with its shareholders.
Summary
In total, we are pretty happy with J. Front Retailing's performance. Specifically, we like that the company is reinvesting a huge chunk of its profits at a high rate of return. This of course has caused the company to see substantial growth in its earnings. Having said that, on studying current analyst estimates, we were concerned to see that while the company has grown its earnings in the past, analysts expect its earnings to shrink in the future. Are these analysts expectations based on the broad expectations for the industry, or on the company's fundamentals? Click here to be taken to our analyst's forecasts page for the company.
New: Manage All Your Stock Portfolios in One Place
We've created the ultimate portfolio companion for stock investors, and it's free.
• Connect an unlimited number of Portfolios and see your total in one currency
• Be alerted to new Warning Signs or Risks via email or mobile
• Track the Fair Value of your stocks
Have feedback on this article? Concerned about the content? Get in touch with us directly. Alternatively, email editorial-team (at) simplywallst.com.
This article by Simply Wall St is general in nature. We provide commentary based on historical data and analyst forecasts only using an unbiased methodology and our articles are not intended to be financial advice. It does not constitute a recommendation to buy or sell any stock, and does not take account of your objectives, or your financial situation. We aim to bring you long-term focused analysis driven by fundamental data. Note that our analysis may not factor in the latest price-sensitive company announcements or qualitative material. Simply Wall St has no position in any stocks mentioned.
About TSE:3086
Solid track record, good value and pays a dividend.
Market Insights

Community Narratives
