
Advertisement

Warren Buffett famously said, 'Volatility is far from synonymous with risk.' So it might be obvious that you need to consider debt, when you think about how risky any given stock is, because too much debt can sink a company. We note that Cox Co., Ltd. (TYO:9876) does have debt on its balance sheet. But the more important question is: how much risk is that debt creating?
What Risk Does Debt Bring?
Debt and other liabilities become risky for a business when it cannot easily fulfill those obligations, either with free cash flow or by raising capital at an attractive price. Ultimately, if the company can't fulfill its legal obligations to repay debt, shareholders could walk away with nothing. While that is not too common, we often do see indebted companies permanently diluting shareholders because lenders force them to raise capital at a distressed price. Of course, plenty of companies use debt to fund growth, without any negative consequences. When we examine debt levels, we first consider both cash and debt levels, together.
See our latest analysis for Cox
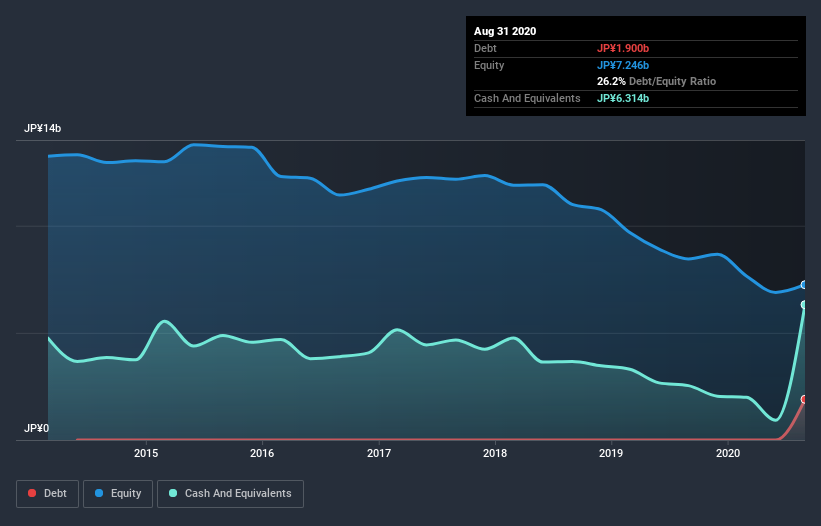
How Much Debt Does Cox Carry?
As you can see below, at the end of August 2020, Cox had JP¥1.90b of debt, up from none a year ago. Click the image for more detail. But it also has JP¥6.31b in cash to offset that, meaning it has JP¥4.41b net cash.
How Healthy Is Cox's Balance Sheet?
The latest balance sheet data shows that Cox had liabilities of JP¥5.92b due within a year, and liabilities of JP¥1.44b falling due after that. Offsetting these obligations, it had cash of JP¥6.31b as well as receivables valued at JP¥1.12b due within 12 months. So these liquid assets roughly match the total liabilities.
Having regard to Cox's size, it seems that its liquid assets are well balanced with its total liabilities. So while it's hard to imagine that the JP¥4.83b company is struggling for cash, we still think it's worth monitoring its balance sheet. Succinctly put, Cox boasts net cash, so it's fair to say it does not have a heavy debt load! When analysing debt levels, the balance sheet is the obvious place to start. But you can't view debt in total isolation; since Cox will need earnings to service that debt. So if you're keen to discover more about its earnings, it might be worth checking out this graph of its long term earnings trend.
Over 12 months, Cox made a loss at the EBIT level, and saw its revenue drop to JP¥16b, which is a fall of 8.1%. We would much prefer see growth.
So How Risky Is Cox?
Although Cox had an earnings before interest and tax (EBIT) loss over the last twelve months, it made a statutory profit of JP¥336m. So when you consider it has net cash, along with the statutory profit, the stock probably isn't as risky as it might seem, at least in the short term. We'll feel more comfortable with the stock once EBIT is positive, given the lacklustre revenue growth. When analysing debt levels, the balance sheet is the obvious place to start. But ultimately, every company can contain risks that exist outside of the balance sheet. Take risks, for example - Cox has 3 warning signs we think you should be aware of.
When all is said and done, sometimes its easier to focus on companies that don't even need debt. Readers can access a list of growth stocks with zero net debt 100% free, right now.
When trading Cox or any other investment, use the platform considered by many to be the Professional's Gateway to the Worlds Market, Interactive Brokers. You get the lowest-cost* trading on stocks, options, futures, forex, bonds and funds worldwide from a single integrated account. Promoted
New: AI Stock Screener & Alerts
Our new AI Stock Screener scans the market every day to uncover opportunities.
• Dividend Powerhouses (3%+ Yield)
• Undervalued Small Caps with Insider Buying
• High growth Tech and AI Companies
Or build your own from over 50 metrics.
This article by Simply Wall St is general in nature. It does not constitute a recommendation to buy or sell any stock, and does not take account of your objectives, or your financial situation. We aim to bring you long-term focused analysis driven by fundamental data. Note that our analysis may not factor in the latest price-sensitive company announcements or qualitative material. Simply Wall St has no position in any stocks mentioned.
*Interactive Brokers Rated Lowest Cost Broker by StockBrokers.com Annual Online Review 2020
Have feedback on this article? Concerned about the content? Get in touch with us directly. Alternatively, email editorial-team (at) simplywallst.com.
About TSE:9876
Cox
Together with its subsidiary, operates as a clothing retailer in Japan.
Flawless balance sheet and good value.
Market Insights


Advertisement
Community Narratives
The Future of Drug Testing? Fingerprint Tech Shows Serious Promise
Fair Value US$2.98|40.3% undervalued
JO
Community Contributor
Suncorp’s Next Chapter: Insurance-Only and Ready to Grow
Fair Value AU$22.83|7.9% undervalued
RO
Community Contributor
Thyssenkrupp Nucera Will Achieve Double-Digit Profits by 2030 Boosted by Hydrogen Growth
Fair Value €14.40|31.3% undervalued
CH
Community Contributor
Tesla’s Nvidia Moment – The AI & Robotics Inflection Point
Fair Value US$359.72|12.3% undervalued
BL
Community Contributor