
Advertisement
- Japan
- /
- Real Estate
- /
- TSE:2970
Not Many Are Piling Into Good Life Company,Inc. (TSE:2970) Stock Yet As It Plummets 37%
Good Life Company,Inc. (TSE:2970) shareholders that were waiting for something to happen have been dealt a blow with a 37% share price drop in the last month. Indeed, the recent drop has reduced its annual gain to a relatively sedate 8.5% over the last twelve months.
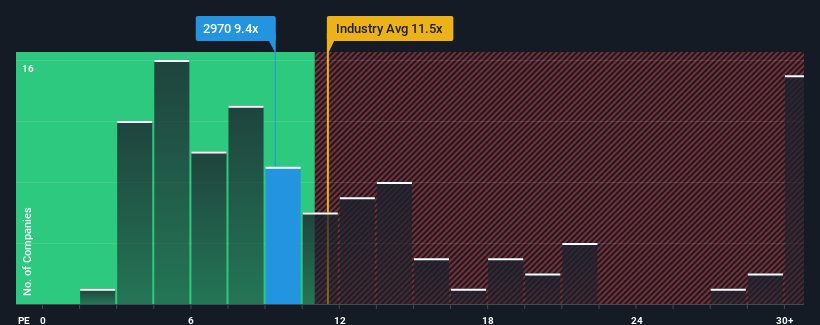
Although its price has dipped substantially, Good Life CompanyInc's price-to-earnings (or "P/E") ratio of 9.4x might still make it look like a buy right now compared to the market in Japan, where around half of the companies have P/E ratios above 14x and even P/E's above 21x are quite common. Nonetheless, we'd need to dig a little deeper to determine if there is a rational basis for the reduced P/E.
Recent times have been quite advantageous for Good Life CompanyInc as its earnings have been rising very briskly. It might be that many expect the strong earnings performance to degrade substantially, which has repressed the P/E. If you like the company, you'd be hoping this isn't the case so that you could potentially pick up some stock while it's out of favour.
See our latest analysis for Good Life CompanyInc
Does Growth Match The Low P/E?
Good Life CompanyInc's P/E ratio would be typical for a company that's only expected to deliver limited growth, and importantly, perform worse than the market.
If we review the last year of earnings growth, the company posted a terrific increase of 58%. The latest three year period has also seen an excellent 253% overall rise in EPS, aided by its short-term performance. Therefore, it's fair to say the earnings growth recently has been superb for the company.
Weighing that recent medium-term earnings trajectory against the broader market's one-year forecast for expansion of 9.8% shows it's noticeably more attractive on an annualised basis.
With this information, we find it odd that Good Life CompanyInc is trading at a P/E lower than the market. Apparently some shareholders believe the recent performance has exceeded its limits and have been accepting significantly lower selling prices.
The Bottom Line On Good Life CompanyInc's P/E
The softening of Good Life CompanyInc's shares means its P/E is now sitting at a pretty low level. While the price-to-earnings ratio shouldn't be the defining factor in whether you buy a stock or not, it's quite a capable barometer of earnings expectations.
Our examination of Good Life CompanyInc revealed its three-year earnings trends aren't contributing to its P/E anywhere near as much as we would have predicted, given they look better than current market expectations. When we see strong earnings with faster-than-market growth, we assume potential risks are what might be placing significant pressure on the P/E ratio. At least price risks look to be very low if recent medium-term earnings trends continue, but investors seem to think future earnings could see a lot of volatility.
Don't forget that there may be other risks. For instance, we've identified 2 warning signs for Good Life CompanyInc (1 is potentially serious) you should be aware of.
If these risks are making you reconsider your opinion on Good Life CompanyInc, explore our interactive list of high quality stocks to get an idea of what else is out there.
New: Manage All Your Stock Portfolios in One Place
We've created the ultimate portfolio companion for stock investors, and it's free.
• Connect an unlimited number of Portfolios and see your total in one currency
• Be alerted to new Warning Signs or Risks via email or mobile
• Track the Fair Value of your stocks
Have feedback on this article? Concerned about the content? Get in touch with us directly. Alternatively, email editorial-team (at) simplywallst.com.
This article by Simply Wall St is general in nature. We provide commentary based on historical data and analyst forecasts only using an unbiased methodology and our articles are not intended to be financial advice. It does not constitute a recommendation to buy or sell any stock, and does not take account of your objectives, or your financial situation. We aim to bring you long-term focused analysis driven by fundamental data. Note that our analysis may not factor in the latest price-sensitive company announcements or qualitative material. Simply Wall St has no position in any stocks mentioned.
Have feedback on this article? Concerned about the content? Get in touch with us directly. Alternatively, email editorial-team@simplywallst.com
About TSE:2970
Good Life CompanyInc
Engages in the design, planning, supervising, purchasing, construction, and sale of rental condominiums in Japan.
Proven track record with adequate balance sheet.
Market Insights

Advertisement
Community Narratives
Quality at a Premium. A time to watch, not to buy?
Fair Value US$154.56|29.3% undervalued
DA
Community Contributor
GRAB: The Super-App at the Heart of Southeast Asia’s Digital Boom
Fair Value US$6.60|7.0% undervalued
BL
Community Contributor
Verve Group to Surge with 51.61% Revenue Growth
Fair Value €6.00|65.0% undervalued
ME
Community Contributor