Companies Like MedRx (TSE:4586) Are In A Position To Invest In Growth


There's no doubt that money can be made by owning shares of unprofitable businesses. For example, biotech and mining exploration companies often lose money for years before finding success with a new treatment or mineral discovery. Having said that, unprofitable companies are risky because they could potentially burn through all their cash and become distressed.
Given this risk, we thought we'd take a look at whether MedRx (TSE:4586) shareholders should be worried about its cash burn. For the purpose of this article, we'll define cash burn as the amount of cash the company is spending each year to fund its growth (also called its negative free cash flow). The first step is to compare its cash burn with its cash reserves, to give us its 'cash runway'.
See our latest analysis for MedRx
When Might MedRx Run Out Of Money?
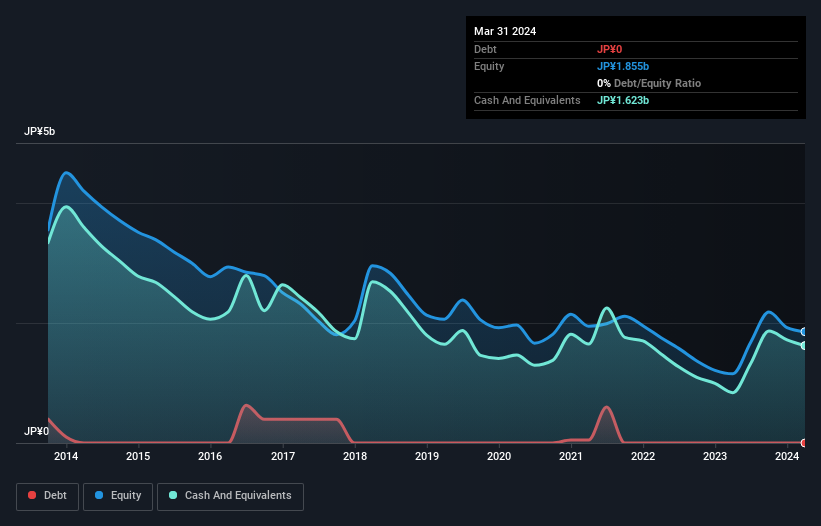
A cash runway is defined as the length of time it would take a company to run out of money if it kept spending at its current rate of cash burn. When MedRx last reported its March 2024 balance sheet in May 2024, it had zero debt and cash worth JP¥1.6b. Importantly, its cash burn was JP¥913m over the trailing twelve months. So it had a cash runway of approximately 21 months from March 2024. While that cash runway isn't too concerning, sensible holders would be peering into the distance, and considering what happens if the company runs out of cash. You can see how its cash balance has changed over time in the image below.
How Is MedRx's Cash Burn Changing Over Time?
In our view, MedRx doesn't yet produce significant amounts of operating revenue, since it reported just JP¥1.0m in the last twelve months. As a result, we think it's a bit early to focus on the revenue growth, so we'll limit ourselves to looking at how the cash burn is changing over time. Even though it doesn't get us excited, the 21% reduction in cash burn year on year does suggest the company can continue operating for quite some time. MedRx makes us a little nervous due to its lack of substantial operating revenue. So we'd generally prefer stocks from this list of stocks that have analysts forecasting growth.
Can MedRx Raise More Cash Easily?
While MedRx is showing a solid reduction in its cash burn, it's still worth considering how easily it could raise more cash, even just to fuel faster growth. Generally speaking, a listed business can raise new cash through issuing shares or taking on debt. Many companies end up issuing new shares to fund future growth. By looking at a company's cash burn relative to its market capitalisation, we gain insight on how much shareholders would be diluted if the company needed to raise enough cash to cover another year's cash burn.
MedRx's cash burn of JP¥913m is about 18% of its JP¥5.2b market capitalisation. Given that situation, it's fair to say the company wouldn't have much trouble raising more cash for growth, but shareholders would be somewhat diluted.
How Risky Is MedRx's Cash Burn Situation?
The good news is that in our view MedRx's cash burn situation gives shareholders real reason for optimism. One the one hand we have its solid cash burn reduction, while on the other it can also boast very strong cash runway. While we're the kind of investors who are always a bit concerned about the risks involved with cash burning companies, the metrics we have discussed in this article leave us relatively comfortable about MedRx's situation. On another note, MedRx has 4 warning signs (and 1 which can't be ignored) we think you should know about.
Of course MedRx may not be the best stock to buy. So you may wish to see this free collection of companies boasting high return on equity, or this list of stocks that insiders are buying.
New: Manage All Your Stock Portfolios in One Place
We've created the ultimate portfolio companion for stock investors, and it's free.
• Connect an unlimited number of Portfolios and see your total in one currency
• Be alerted to new Warning Signs or Risks via email or mobile
• Track the Fair Value of your stocks
Have feedback on this article? Concerned about the content? Get in touch with us directly. Alternatively, email editorial-team (at) simplywallst.com.
This article by Simply Wall St is general in nature. We provide commentary based on historical data and analyst forecasts only using an unbiased methodology and our articles are not intended to be financial advice. It does not constitute a recommendation to buy or sell any stock, and does not take account of your objectives, or your financial situation. We aim to bring you long-term focused analysis driven by fundamental data. Note that our analysis may not factor in the latest price-sensitive company announcements or qualitative material. Simply Wall St has no position in any stocks mentioned.
About TSE:4586
MedRx
A pharmaceutical formulation development company, provides pharmaceutical drugs based on the transdermal absorption system in Japan.
Flawless balance sheet low.
Market Insights

Community Narratives

