

The external fund manager backed by Berkshire Hathaway's Charlie Munger, Li Lu, makes no bones about it when he says 'The biggest investment risk is not the volatility of prices, but whether you will suffer a permanent loss of capital.' So it seems the smart money knows that debt - which is usually involved in bankruptcies - is a very important factor, when you assess how risky a company is. As with many other companies toridori Inc. (TSE:9337) makes use of debt. But is this debt a concern to shareholders?
When Is Debt A Problem?
Generally speaking, debt only becomes a real problem when a company can't easily pay it off, either by raising capital or with its own cash flow. Ultimately, if the company can't fulfill its legal obligations to repay debt, shareholders could walk away with nothing. While that is not too common, we often do see indebted companies permanently diluting shareholders because lenders force them to raise capital at a distressed price. Of course, plenty of companies use debt to fund growth, without any negative consequences. When we examine debt levels, we first consider both cash and debt levels, together.
See our latest analysis for toridori
What Is toridori's Debt?
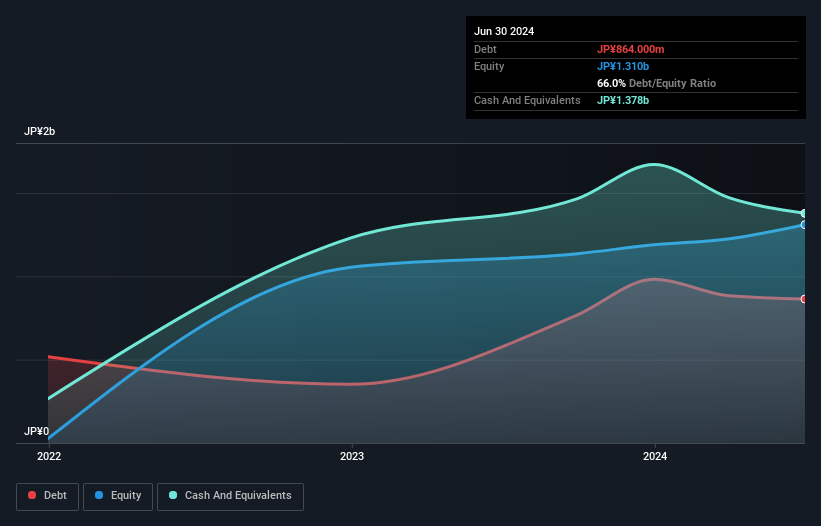
The image below, which you can click on for greater detail, shows that at June 2024 toridori had debt of JP¥864.0m, up from JP¥769.0m in one year. However, its balance sheet shows it holds JP¥1.38b in cash, so it actually has JP¥514.0m net cash.
How Healthy Is toridori's Balance Sheet?
Zooming in on the latest balance sheet data, we can see that toridori had liabilities of JP¥1.59b due within 12 months and liabilities of JP¥280.0m due beyond that. Offsetting these obligations, it had cash of JP¥1.38b as well as receivables valued at JP¥752.0m due within 12 months. So it can boast JP¥262.0m more liquid assets than total liabilities.
This short term liquidity is a sign that toridori could probably pay off its debt with ease, as its balance sheet is far from stretched. Simply put, the fact that toridori has more cash than debt is arguably a good indication that it can manage its debt safely.
Although toridori made a loss at the EBIT level, last year, it was also good to see that it generated JP¥204m in EBIT over the last twelve months. The balance sheet is clearly the area to focus on when you are analysing debt. But you can't view debt in total isolation; since toridori will need earnings to service that debt. So when considering debt, it's definitely worth looking at the earnings trend. Click here for an interactive snapshot.
Finally, while the tax-man may adore accounting profits, lenders only accept cold hard cash. While toridori has net cash on its balance sheet, it's still worth taking a look at its ability to convert earnings before interest and tax (EBIT) to free cash flow, to help us understand how quickly it is building (or eroding) that cash balance. During the last year, toridori burned a lot of cash. While that may be a result of expenditure for growth, it does make the debt far more risky.
Summing Up
While we empathize with investors who find debt concerning, you should keep in mind that toridori has net cash of JP¥514.0m, as well as more liquid assets than liabilities. So we don't have any problem with toridori's use of debt. There's no doubt that we learn most about debt from the balance sheet. But ultimately, every company can contain risks that exist outside of the balance sheet. These risks can be hard to spot. Every company has them, and we've spotted 4 warning signs for toridori (of which 2 are potentially serious!) you should know about.
Of course, if you're the type of investor who prefers buying stocks without the burden of debt, then don't hesitate to discover our exclusive list of net cash growth stocks, today.
If you're looking to trade toridori, open an account with the lowest-cost platform trusted by professionals, Interactive Brokers.
With clients in over 200 countries and territories, and access to 160 markets, IBKR lets you trade stocks, options, futures, forex, bonds and funds from a single integrated account.
Enjoy no hidden fees, no account minimums, and FX conversion rates as low as 0.03%, far better than what most brokers offer.
Sponsored ContentNew: Manage All Your Stock Portfolios in One Place
We've created the ultimate portfolio companion for stock investors, and it's free.
• Connect an unlimited number of Portfolios and see your total in one currency
• Be alerted to new Warning Signs or Risks via email or mobile
• Track the Fair Value of your stocks
Have feedback on this article? Concerned about the content? Get in touch with us directly. Alternatively, email editorial-team (at) simplywallst.com.
This article by Simply Wall St is general in nature. We provide commentary based on historical data and analyst forecasts only using an unbiased methodology and our articles are not intended to be financial advice. It does not constitute a recommendation to buy or sell any stock, and does not take account of your objectives, or your financial situation. We aim to bring you long-term focused analysis driven by fundamental data. Note that our analysis may not factor in the latest price-sensitive company announcements or qualitative material. Simply Wall St has no position in any stocks mentioned.
About TSE:9337
Adequate balance sheet low.
Market Insights

Community Narratives

