
Advertisement
- Japan
- /
- Interactive Media and Services
- /
- TSE:6184
Kamakura Shinsho's (TSE:6184) Profits May Not Reveal Underlying Issues

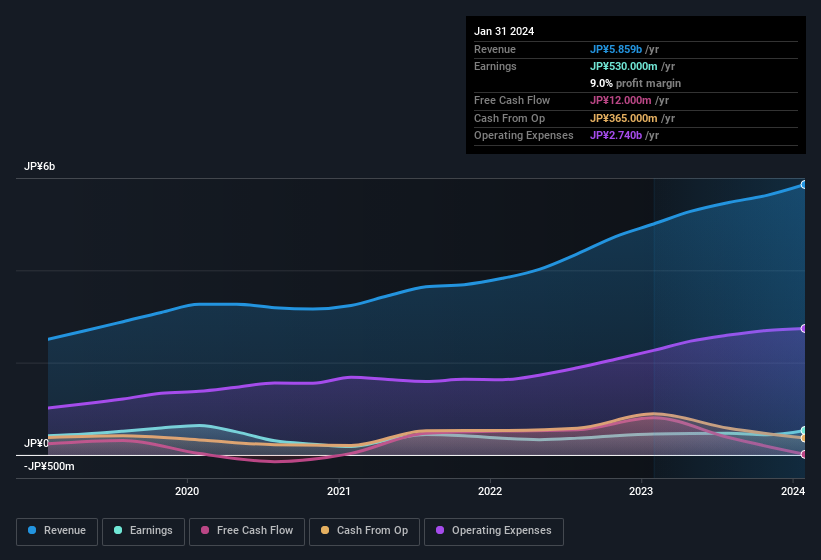
Following the solid earnings report from Kamakura Shinsho, Ltd. (TSE:6184), the market responded by bidding up the stock price. However, we think that shareholders should be cautious as we found some worrying factors underlying the profit.
View our latest analysis for Kamakura Shinsho
Zooming In On Kamakura Shinsho's Earnings
Many investors haven't heard of the accrual ratio from cashflow, but it is actually a useful measure of how well a company's profit is backed up by free cash flow (FCF) during a given period. To get the accrual ratio we first subtract FCF from profit for a period, and then divide that number by the average operating assets for the period. This ratio tells us how much of a company's profit is not backed by free cashflow.
Therefore, it's actually considered a good thing when a company has a negative accrual ratio, but a bad thing if its accrual ratio is positive. That is not intended to imply we should worry about a positive accrual ratio, but it's worth noting where the accrual ratio is rather high. That's because some academic studies have suggested that high accruals ratios tend to lead to lower profit or less profit growth.
Over the twelve months to January 2024, Kamakura Shinsho recorded an accrual ratio of 0.49. That means it didn't generate anywhere near enough free cash flow to match its profit. Statistically speaking, that's a real negative for future earnings. In fact, it had free cash flow of JP¥12m in the last year, which was a lot less than its statutory profit of JP¥530.0m. Kamakura Shinsho's free cash flow actually declined over the last year, but it may bounce back next year, since free cash flow is often more volatile than accounting profits. The good news for shareholders is that Kamakura Shinsho's accrual ratio was much better last year, so this year's poor reading might simply be a case of a short term mismatch between profit and FCF. As a result, some shareholders may be looking for stronger cash conversion in the current year.
Note: we always recommend investors check balance sheet strength. Click here to be taken to our balance sheet analysis of Kamakura Shinsho.
Our Take On Kamakura Shinsho's Profit Performance
As we have made quite clear, we're a bit worried that Kamakura Shinsho didn't back up the last year's profit with free cashflow. For this reason, we think that Kamakura Shinsho's statutory profits may be a bad guide to its underlying earnings power, and might give investors an overly positive impression of the company. But on the bright side, its earnings per share have grown at an extremely impressive rate over the last three years. The goal of this article has been to assess how well we can rely on the statutory earnings to reflect the company's potential, but there is plenty more to consider. So while earnings quality is important, it's equally important to consider the risks facing Kamakura Shinsho at this point in time. For example, Kamakura Shinsho has 3 warning signs (and 2 which are significant) we think you should know about.
This note has only looked at a single factor that sheds light on the nature of Kamakura Shinsho's profit. But there is always more to discover if you are capable of focussing your mind on minutiae. For example, many people consider a high return on equity as an indication of favorable business economics, while others like to 'follow the money' and search out stocks that insiders are buying. While it might take a little research on your behalf, you may find this free collection of companies boasting high return on equity, or this list of stocks that insiders are buying to be useful.
Valuation is complex, but we're here to simplify it.
Discover if Kamakura Shinsho might be undervalued or overvalued with our detailed analysis, featuring fair value estimates, potential risks, dividends, insider trades, and its financial condition.
Access Free AnalysisHave feedback on this article? Concerned about the content? Get in touch with us directly. Alternatively, email editorial-team (at) simplywallst.com.
This article by Simply Wall St is general in nature. We provide commentary based on historical data and analyst forecasts only using an unbiased methodology and our articles are not intended to be financial advice. It does not constitute a recommendation to buy or sell any stock, and does not take account of your objectives, or your financial situation. We aim to bring you long-term focused analysis driven by fundamental data. Note that our analysis may not factor in the latest price-sensitive company announcements or qualitative material. Simply Wall St has no position in any stocks mentioned.
About TSE:6184
Kamakura Shinsho
Operates a portal site that provides information services related to end of life in Japan.
Excellent balance sheet with proven track record.
Market Insights

Advertisement
Community Narratives

BMW cruising ahead with new EVs and premium models to boost revenue 5%
Fair Value €135.07|44.6% undervalued
UN
Community Contributor
EU#2 - From Humble Beginnings to Global Powerhouse
Fair Value DKK 851.04|46.2% undervalued
TO
Community Contributor