- Japan
- /
- Interactive Media and Services
- /
- TSE:6048
Investors Give DesignOne Japan, Inc. (TSE:6048) Shares A 34% Hiding


DesignOne Japan, Inc. (TSE:6048) shareholders won't be pleased to see that the share price has had a very rough month, dropping 34% and undoing the prior period's positive performance. Instead of being rewarded, shareholders who have already held through the last twelve months are now sitting on a 37% share price drop.
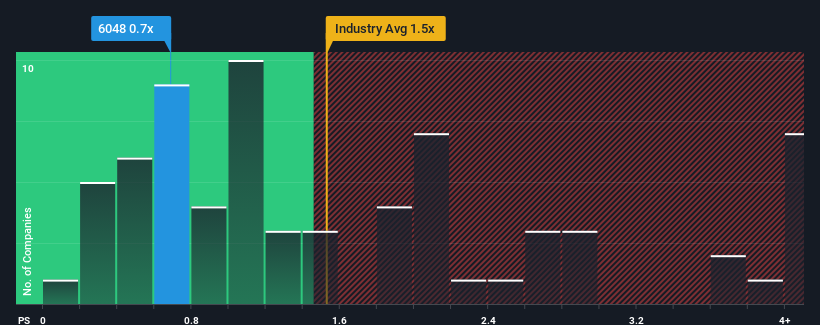
Since its price has dipped substantially, given about half the companies operating in Japan's Interactive Media and Services industry have price-to-sales ratios (or "P/S") above 1.5x, you may consider DesignOne Japan as an attractive investment with its 0.7x P/S ratio. Although, it's not wise to just take the P/S at face value as there may be an explanation why it's limited.
See our latest analysis for DesignOne Japan
How DesignOne Japan Has Been Performing
As an illustration, revenue has deteriorated at DesignOne Japan over the last year, which is not ideal at all. One possibility is that the P/S is low because investors think the company won't do enough to avoid underperforming the broader industry in the near future. However, if this doesn't eventuate then existing shareholders may be feeling optimistic about the future direction of the share price.
We don't have analyst forecasts, but you can see how recent trends are setting up the company for the future by checking out our free report on DesignOne Japan's earnings, revenue and cash flow.How Is DesignOne Japan's Revenue Growth Trending?
In order to justify its P/S ratio, DesignOne Japan would need to produce sluggish growth that's trailing the industry.
In reviewing the last year of financials, we were disheartened to see the company's revenues fell to the tune of 5.2%. This has soured the latest three-year period, which nevertheless managed to deliver a decent 29% overall rise in revenue. Accordingly, while they would have preferred to keep the run going, shareholders would be roughly satisfied with the medium-term rates of revenue growth.
Weighing that recent medium-term revenue trajectory against the broader industry's one-year forecast for expansion of 11% shows it's about the same on an annualised basis.
With this in consideration, we find it intriguing that DesignOne Japan's P/S falls short of its industry peers. It may be that most investors are not convinced the company can maintain recent growth rates.
What We Can Learn From DesignOne Japan's P/S?
DesignOne Japan's P/S has taken a dip along with its share price. We'd say the price-to-sales ratio's power isn't primarily as a valuation instrument but rather to gauge current investor sentiment and future expectations.
The fact that DesignOne Japan currently trades at a low P/S relative to the industry is unexpected considering its recent three-year growth is in line with the wider industry forecast. When we see industry-like revenue growth but a lower than expected P/S, we assume potential risks are what might be placing downward pressure on the share price. At least the risk of a price drop looks to be subdued if recent medium-term revenue trends continue, but investors seem to think future revenue could see some volatility.
It is also worth noting that we have found 3 warning signs for DesignOne Japan (1 shouldn't be ignored!) that you need to take into consideration.
If these risks are making you reconsider your opinion on DesignOne Japan, explore our interactive list of high quality stocks to get an idea of what else is out there.
New: Manage All Your Stock Portfolios in One Place
We've created the ultimate portfolio companion for stock investors, and it's free.
• Connect an unlimited number of Portfolios and see your total in one currency
• Be alerted to new Warning Signs or Risks via email or mobile
• Track the Fair Value of your stocks
Have feedback on this article? Concerned about the content? Get in touch with us directly. Alternatively, email editorial-team (at) simplywallst.com.
This article by Simply Wall St is general in nature. We provide commentary based on historical data and analyst forecasts only using an unbiased methodology and our articles are not intended to be financial advice. It does not constitute a recommendation to buy or sell any stock, and does not take account of your objectives, or your financial situation. We aim to bring you long-term focused analysis driven by fundamental data. Note that our analysis may not factor in the latest price-sensitive company announcements or qualitative material. Simply Wall St has no position in any stocks mentioned.
Have feedback on this article? Concerned about the content? Get in touch with us directly. Alternatively, email editorial-team@simplywallst.com
About TSE:6048
DesignOne Japan
Engages in the internet media business primarily in Japan.
Excellent balance sheet and slightly overvalued.
Market Insights

Community Narratives
