- Japan
- /
- Entertainment
- /
- TSE:5253
What You Can Learn From COVER Corporation's (TSE:5253) P/E After Its 25% Share Price Crash

COVER Corporation (TSE:5253) shareholders that were waiting for something to happen have been dealt a blow with a 25% share price drop in the last month. Longer-term shareholders would now have taken a real hit with the stock declining 7.1% in the last year.
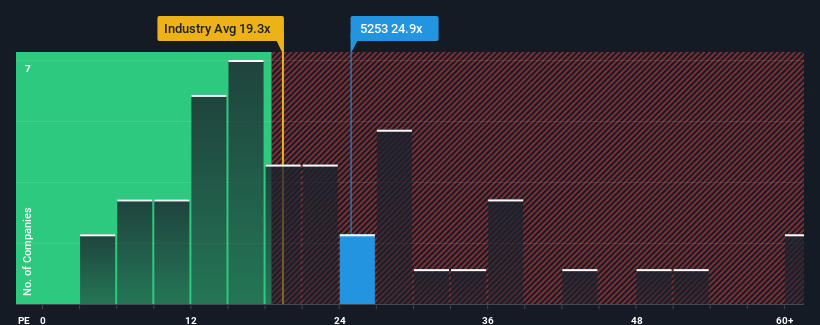
Although its price has dipped substantially, COVER may still be sending very bearish signals at the moment with a price-to-earnings (or "P/E") ratio of 24.9x, since almost half of all companies in Japan have P/E ratios under 12x and even P/E's lower than 8x are not unusual. However, the P/E might be quite high for a reason and it requires further investigation to determine if it's justified.
With earnings growth that's superior to most other companies of late, COVER has been doing relatively well. The P/E is probably high because investors think this strong earnings performance will continue. You'd really hope so, otherwise you're paying a pretty hefty price for no particular reason.
See our latest analysis for COVER
Does Growth Match The High P/E?
In order to justify its P/E ratio, COVER would need to produce outstanding growth well in excess of the market.
If we review the last year of earnings growth, the company posted a terrific increase of 35%. Pleasingly, EPS has also lifted 286% in aggregate from three years ago, thanks to the last 12 months of growth. Accordingly, shareholders would have probably welcomed those medium-term rates of earnings growth.
Shifting to the future, estimates from the six analysts covering the company suggest earnings should grow by 35% per year over the next three years. Meanwhile, the rest of the market is forecast to only expand by 9.7% per annum, which is noticeably less attractive.
In light of this, it's understandable that COVER's P/E sits above the majority of other companies. It seems most investors are expecting this strong future growth and are willing to pay more for the stock.
The Bottom Line On COVER's P/E
Even after such a strong price drop, COVER's P/E still exceeds the rest of the market significantly. It's argued the price-to-earnings ratio is an inferior measure of value within certain industries, but it can be a powerful business sentiment indicator.
As we suspected, our examination of COVER's analyst forecasts revealed that its superior earnings outlook is contributing to its high P/E. Right now shareholders are comfortable with the P/E as they are quite confident future earnings aren't under threat. Unless these conditions change, they will continue to provide strong support to the share price.
It's always necessary to consider the ever-present spectre of investment risk. We've identified 1 warning sign with COVER , and understanding should be part of your investment process.
If P/E ratios interest you, you may wish to see this free collection of other companies with strong earnings growth and low P/E ratios.
Mobile Infrastructure for Defense and Disaster
The next wave in robotics isn't humanoid. Its fully autonomous towers delivering 5G, ISR, and radar in under 30 minutes, anywhere.
Get the investor briefing before the next round of contracts
Sponsored On Behalf of CiTechNew: AI Stock Screener & Alerts
Our new AI Stock Screener scans the market every day to uncover opportunities.
• Dividend Powerhouses (3%+ Yield)
• Undervalued Small Caps with Insider Buying
• High growth Tech and AI Companies
Or build your own from over 50 metrics.
Have feedback on this article? Concerned about the content? Get in touch with us directly. Alternatively, email editorial-team (at) simplywallst.com.
This article by Simply Wall St is general in nature. We provide commentary based on historical data and analyst forecasts only using an unbiased methodology and our articles are not intended to be financial advice. It does not constitute a recommendation to buy or sell any stock, and does not take account of your objectives, or your financial situation. We aim to bring you long-term focused analysis driven by fundamental data. Note that our analysis may not factor in the latest price-sensitive company announcements or qualitative material. Simply Wall St has no position in any stocks mentioned.
About TSE:5253
COVER
COVER Corporation distribute videos and music through VTubers distribution platform in Japan.
Flawless balance sheet and undervalued.
Similar Companies
Market Insights

Weekly Picks

Early mover in a fast growing industry. Likely to experience share price volatility as they scale


A case for CA$31.80 (undiluted), aka 8,616% upside from CA$0.37 (an 86 bagger!).


Moderation and Stabilisation: HOLD: Fair Price based on a 4-year Cycle is $12.08
Recently Updated Narratives

Airbnb Stock: Platform Growth in a World of Saturation and Scrutiny

Clarivate Stock: When Data Becomes the Backbone of Innovation and Law

Adobe Stock: AI-Fueled ARR Growth Pushes Guidance Higher, But Cost Pressures Loom
Popular Narratives


Crazy Undervalued 42 Baggers Silver Play (Active & Running Mine)


NVDA: Expanding AI Demand Will Drive Major Data Center Investments Through 2026


MicroVision will explode future revenue by 380.37% with a vision towards success
Trending Discussion
