
Advertisement
- Japan
- /
- Interactive Media and Services
- /
- TSE:4689
These 4 Measures Indicate That LY (TSE:4689) Is Using Debt Reasonably Well
The external fund manager backed by Berkshire Hathaway's Charlie Munger, Li Lu, makes no bones about it when he says 'The biggest investment risk is not the volatility of prices, but whether you will suffer a permanent loss of capital.' When we think about how risky a company is, we always like to look at its use of debt, since debt overload can lead to ruin. We note that LY Corporation (TSE:4689) does have debt on its balance sheet. But is this debt a concern to shareholders?
What Risk Does Debt Bring?
Debt is a tool to help businesses grow, but if a business is incapable of paying off its lenders, then it exists at their mercy. Part and parcel of capitalism is the process of 'creative destruction' where failed businesses are mercilessly liquidated by their bankers. However, a more usual (but still expensive) situation is where a company must dilute shareholders at a cheap share price simply to get debt under control. Of course, the upside of debt is that it often represents cheap capital, especially when it replaces dilution in a company with the ability to reinvest at high rates of return. When we think about a company's use of debt, we first look at cash and debt together.
What Is LY's Net Debt?
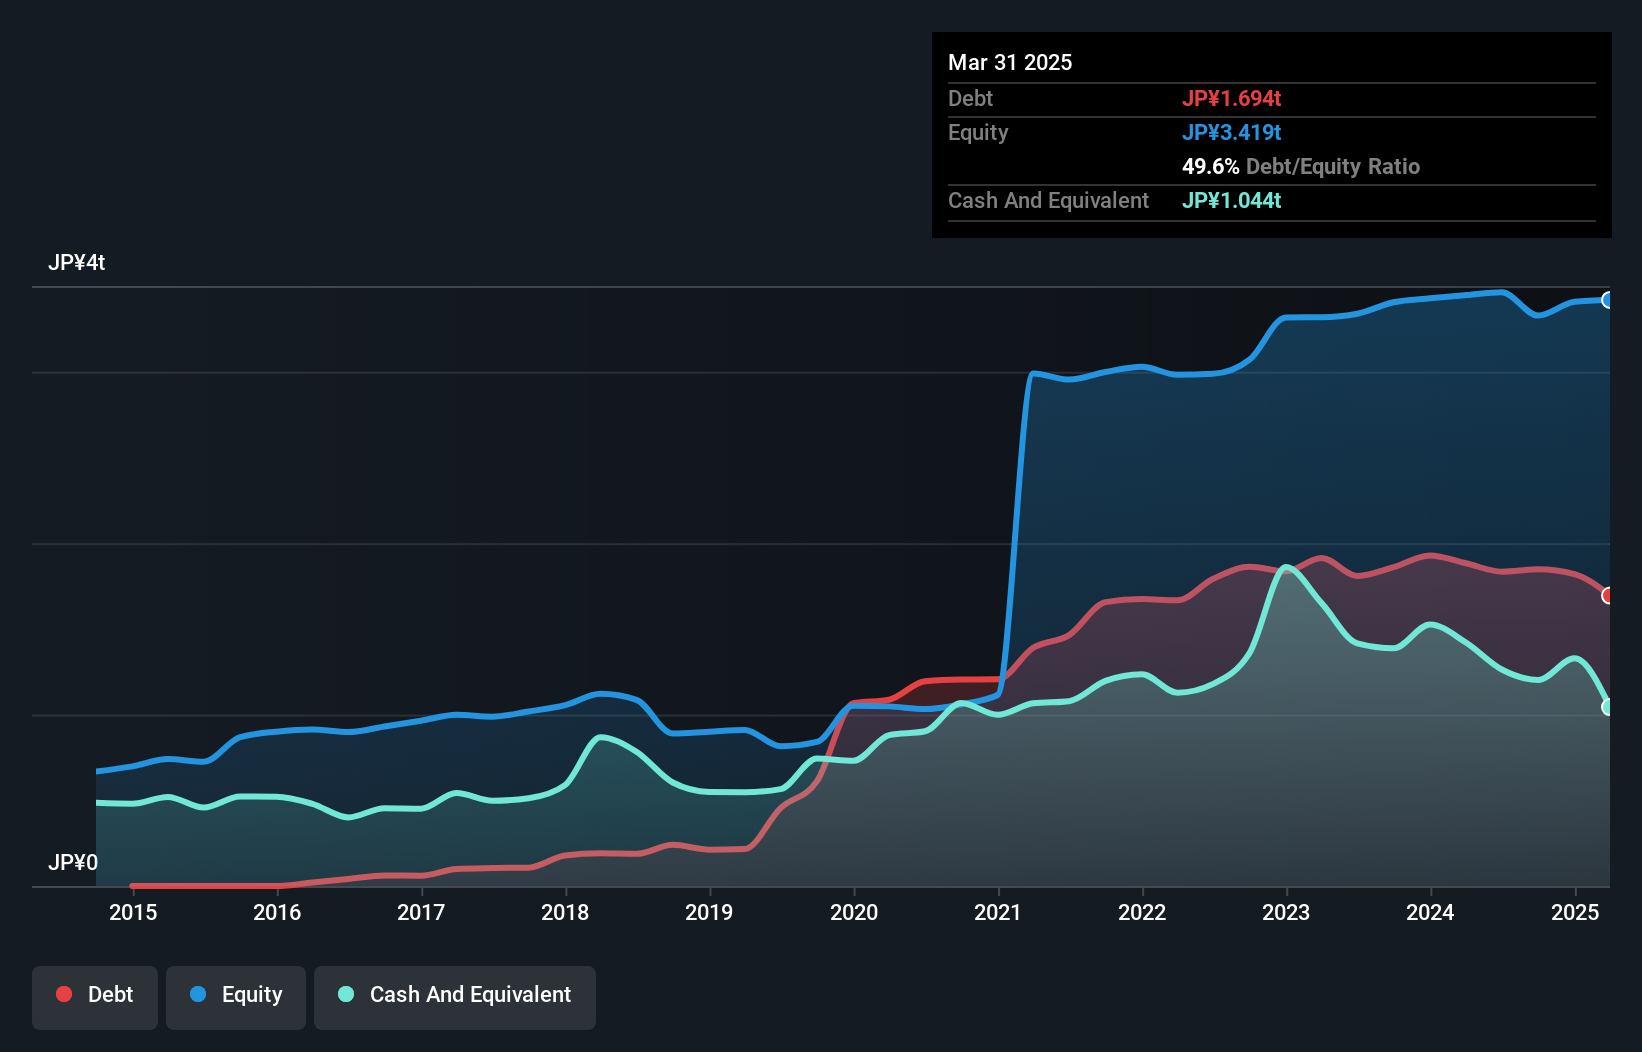
The image below, which you can click on for greater detail, shows that LY had debt of JP¥1.69t at the end of March 2025, a reduction from JP¥1.88t over a year. However, because it has a cash reserve of JP¥1.04t, its net debt is less, at about JP¥650.5b.
How Healthy Is LY's Balance Sheet?
According to the last reported balance sheet, LY had liabilities of JP¥3.59t due within 12 months, and liabilities of JP¥2.15t due beyond 12 months. Offsetting these obligations, it had cash of JP¥1.04t as well as receivables valued at JP¥1.66t due within 12 months. So it has liabilities totalling JP¥3.04t more than its cash and near-term receivables, combined.
This is a mountain of leverage even relative to its gargantuan market capitalization of JP¥3.98t. Should its lenders demand that it shore up the balance sheet, shareholders would likely face severe dilution.
View our latest analysis for LY
We use two main ratios to inform us about debt levels relative to earnings. The first is net debt divided by earnings before interest, tax, depreciation, and amortization (EBITDA), while the second is how many times its earnings before interest and tax (EBIT) covers its interest expense (or its interest cover, for short). This way, we consider both the absolute quantum of the debt, as well as the interest rates paid on it.
LY has a low net debt to EBITDA ratio of only 1.4. And its EBIT covers its interest expense a whopping 39.0 times over. So you could argue it is no more threatened by its debt than an elephant is by a mouse. On top of that, LY grew its EBIT by 48% over the last twelve months, and that growth will make it easier to handle its debt. When analysing debt levels, the balance sheet is the obvious place to start. But ultimately the future profitability of the business will decide if LY can strengthen its balance sheet over time. So if you want to see what the professionals think, you might find this free report on analyst profit forecasts to be interesting.
Finally, a company can only pay off debt with cold hard cash, not accounting profits. So the logical step is to look at the proportion of that EBIT that is matched by actual free cash flow. Over the last three years, LY recorded free cash flow worth a fulsome 89% of its EBIT, which is stronger than we'd usually expect. That positions it well to pay down debt if desirable to do so.
Our View
Happily, LY's impressive interest cover implies it has the upper hand on its debt. But, on a more sombre note, we are a little concerned by its level of total liabilities. Taking all this data into account, it seems to us that LY takes a pretty sensible approach to debt. While that brings some risk, it can also enhance returns for shareholders. Over time, share prices tend to follow earnings per share, so if you're interested in LY, you may well want to click here to check an interactive graph of its earnings per share history.
If you're interested in investing in businesses that can grow profits without the burden of debt, then check out this free list of growing businesses that have net cash on the balance sheet.
New: AI Stock Screener & Alerts
Our new AI Stock Screener scans the market every day to uncover opportunities.
• Dividend Powerhouses (3%+ Yield)
• Undervalued Small Caps with Insider Buying
• High growth Tech and AI Companies
Or build your own from over 50 metrics.
Have feedback on this article? Concerned about the content? Get in touch with us directly. Alternatively, email editorial-team (at) simplywallst.com.
This article by Simply Wall St is general in nature. We provide commentary based on historical data and analyst forecasts only using an unbiased methodology and our articles are not intended to be financial advice. It does not constitute a recommendation to buy or sell any stock, and does not take account of your objectives, or your financial situation. We aim to bring you long-term focused analysis driven by fundamental data. Note that our analysis may not factor in the latest price-sensitive company announcements or qualitative material. Simply Wall St has no position in any stocks mentioned.
About TSE:4689
Flawless balance sheet and undervalued.
Similar Companies
Market Insights

Advertisement
Community Narratives
Kodiak AI - a potential 100 bagger opportunity?
Fair Value US$14.00|44.7% undervalued
DA
Community Contributor
A Fair Price for a Great Business Facing Real Threats
Fair Value US$383.06|13.0% undervalued
IM
Community Contributor
AXON And Shopify Integration Will Unlock Global Mobile Advertising
Fair Value US$646.30|0% overvalued
AN
Based on Analyst Price Targets