- Japan
- /
- Entertainment
- /
- TSE:3758
Aeria Inc. (TSE:3758) Not Doing Enough For Some Investors As Its Shares Slump 33%


Unfortunately for some shareholders, the Aeria Inc. (TSE:3758) share price has dived 33% in the last thirty days, prolonging recent pain. For any long-term shareholders, the last month ends a year to forget by locking in a 50% share price decline.
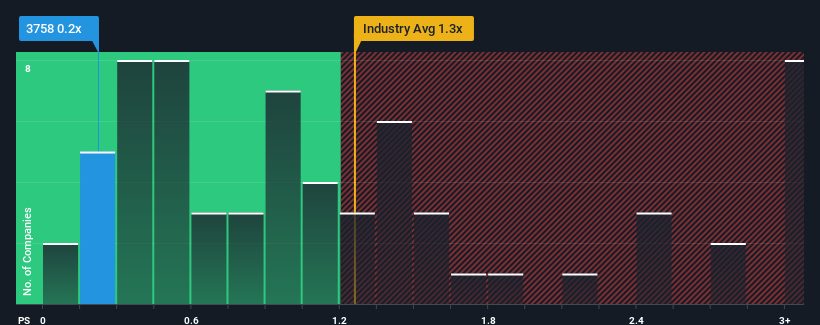
Since its price has dipped substantially, considering around half the companies operating in Japan's Entertainment industry have price-to-sales ratios (or "P/S") above 1.3x, you may consider Aeria as an solid investment opportunity with its 0.2x P/S ratio. Although, it's not wise to just take the P/S at face value as there may be an explanation why it's limited.
See our latest analysis for Aeria
What Does Aeria's Recent Performance Look Like?
For example, consider that Aeria's financial performance has been poor lately as its revenue has been in decline. One possibility is that the P/S is low because investors think the company won't do enough to avoid underperforming the broader industry in the near future. However, if this doesn't eventuate then existing shareholders may be feeling optimistic about the future direction of the share price.
Want the full picture on earnings, revenue and cash flow for the company? Then our free report on Aeria will help you shine a light on its historical performance.What Are Revenue Growth Metrics Telling Us About The Low P/S?
In order to justify its P/S ratio, Aeria would need to produce sluggish growth that's trailing the industry.
In reviewing the last year of financials, we were disheartened to see the company's revenues fell to the tune of 5.3%. As a result, revenue from three years ago have also fallen 14% overall. Accordingly, shareholders would have felt downbeat about the medium-term rates of revenue growth.
Comparing that to the industry, which is predicted to shrink 2.2% in the next 12 months, the company's downward momentum is still inferior based on recent medium-term annualised revenue results.
In light of this, it's understandable that Aeria's P/S sits below the majority of other companies. However, when revenue shrink rapidly P/S often shrinks too, which could set up shareholders for future disappointment regardless. Even just maintaining these prices will be difficult to achieve as recent revenue trends are already weighing down the shares heavily.
What Does Aeria's P/S Mean For Investors?
The southerly movements of Aeria's shares means its P/S is now sitting at a pretty low level. Typically, we'd caution against reading too much into price-to-sales ratios when settling on investment decisions, though it can reveal plenty about what other market participants think about the company.
As expected, our analysis of Aeria confirms that the company's severe contraction in revenue over the past three-year years is a major contributor to its lower than industry P/S, given the industry is set to decline less. At this stage investors feel the potential for an improvement in revenue isn't great enough to justify a higher P/S ratio. However, we're still cautious about the company's ability to prevent an acceleration of its recent medium-term course and resist even greater pain to its business from the broader industry turmoil. In the meantime, unless the company's relative performance improves, the share price will hit a barrier around these levels.
Having said that, be aware Aeria is showing 3 warning signs in our investment analysis, and 2 of those are potentially serious.
Of course, profitable companies with a history of great earnings growth are generally safer bets. So you may wish to see this free collection of other companies that have reasonable P/E ratios and have grown earnings strongly.
If you're looking to trade Aeria, open an account with the lowest-cost platform trusted by professionals, Interactive Brokers.
With clients in over 200 countries and territories, and access to 160 markets, IBKR lets you trade stocks, options, futures, forex, bonds and funds from a single integrated account.
Enjoy no hidden fees, no account minimums, and FX conversion rates as low as 0.03%, far better than what most brokers offer.
Sponsored ContentNew: Manage All Your Stock Portfolios in One Place
We've created the ultimate portfolio companion for stock investors, and it's free.
• Connect an unlimited number of Portfolios and see your total in one currency
• Be alerted to new Warning Signs or Risks via email or mobile
• Track the Fair Value of your stocks
Have feedback on this article? Concerned about the content? Get in touch with us directly. Alternatively, email editorial-team (at) simplywallst.com.
This article by Simply Wall St is general in nature. We provide commentary based on historical data and analyst forecasts only using an unbiased methodology and our articles are not intended to be financial advice. It does not constitute a recommendation to buy or sell any stock, and does not take account of your objectives, or your financial situation. We aim to bring you long-term focused analysis driven by fundamental data. Note that our analysis may not factor in the latest price-sensitive company announcements or qualitative material. Simply Wall St has no position in any stocks mentioned.
Have feedback on this article? Concerned about the content? Get in touch with us directly. Alternatively, email editorial-team@simplywallst.com
About TSE:3758
Mediocre balance sheet and slightly overvalued.

