Calculating The Intrinsic Value Of Carta Holdings, Inc. (TSE:3688)


Key Insights
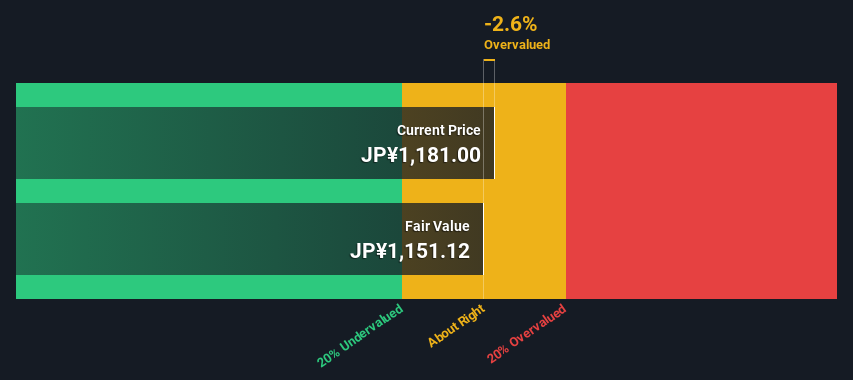
- Using the 2 Stage Free Cash Flow to Equity, Carta Holdings fair value estimate is JP¥1,151
- With JP¥1,181 share price, Carta Holdings appears to be trading close to its estimated fair value
- The average discount for Carta Holdings' competitorsis currently 32%
Does the August share price for Carta Holdings, Inc. (TSE:3688) reflect what it's really worth? Today, we will estimate the stock's intrinsic value by projecting its future cash flows and then discounting them to today's value. This will be done using the Discounted Cash Flow (DCF) model. Before you think you won't be able to understand it, just read on! It's actually much less complex than you'd imagine.
Remember though, that there are many ways to estimate a company's value, and a DCF is just one method. Anyone interested in learning a bit more about intrinsic value should have a read of the Simply Wall St analysis model.
Check out our latest analysis for Carta Holdings
The Model
We're using the 2-stage growth model, which simply means we take in account two stages of company's growth. In the initial period the company may have a higher growth rate and the second stage is usually assumed to have a stable growth rate. In the first stage we need to estimate the cash flows to the business over the next ten years. Seeing as no analyst estimates of free cash flow are available to us, we have extrapolate the previous free cash flow (FCF) from the company's last reported value. We assume companies with shrinking free cash flow will slow their rate of shrinkage, and that companies with growing free cash flow will see their growth rate slow, over this period. We do this to reflect that growth tends to slow more in the early years than it does in later years.
A DCF is all about the idea that a dollar in the future is less valuable than a dollar today, so we discount the value of these future cash flows to their estimated value in today's dollars:
10-year free cash flow (FCF) forecast
| 2025 | 2026 | 2027 | 2028 | 2029 | 2030 | 2031 | 2032 | 2033 | 2034 | |
| Levered FCF (¥, Millions) | JP¥1.17b | JP¥1.19b | JP¥1.21b | JP¥1.22b | JP¥1.23b | JP¥1.24b | JP¥1.25b | JP¥1.26b | JP¥1.26b | JP¥1.26b |
| Growth Rate Estimate Source | Est @ 2.86% | Est @ 2.08% | Est @ 1.54% | Est @ 1.15% | Est @ 0.88% | Est @ 0.70% | Est @ 0.57% | Est @ 0.47% | Est @ 0.41% | Est @ 0.37% |
| Present Value (¥, Millions) Discounted @ 4.5% | JP¥1.1k | JP¥1.1k | JP¥1.1k | JP¥1.0k | JP¥991 | JP¥955 | JP¥919 | JP¥884 | JP¥850 | JP¥816 |
("Est" = FCF growth rate estimated by Simply Wall St)
Present Value of 10-year Cash Flow (PVCF) = JP¥9.7b
The second stage is also known as Terminal Value, this is the business's cash flow after the first stage. For a number of reasons a very conservative growth rate is used that cannot exceed that of a country's GDP growth. In this case we have used the 5-year average of the 10-year government bond yield (0.3%) to estimate future growth. In the same way as with the 10-year 'growth' period, we discount future cash flows to today's value, using a cost of equity of 4.5%.
Terminal Value (TV)= FCF2034 × (1 + g) ÷ (r – g) = JP¥1.3b× (1 + 0.3%) ÷ (4.5%– 0.3%) = JP¥30b
Present Value of Terminal Value (PVTV)= TV / (1 + r)10= JP¥30b÷ ( 1 + 4.5%)10= JP¥19b
The total value is the sum of cash flows for the next ten years plus the discounted terminal value, which results in the Total Equity Value, which in this case is JP¥29b. In the final step we divide the equity value by the number of shares outstanding. Compared to the current share price of JP¥1.2k, the company appears around fair value at the time of writing. Remember though, that this is just an approximate valuation, and like any complex formula - garbage in, garbage out.
Important Assumptions
We would point out that the most important inputs to a discounted cash flow are the discount rate and of course the actual cash flows. Part of investing is coming up with your own evaluation of a company's future performance, so try the calculation yourself and check your own assumptions. The DCF also does not consider the possible cyclicality of an industry, or a company's future capital requirements, so it does not give a full picture of a company's potential performance. Given that we are looking at Carta Holdings as potential shareholders, the cost of equity is used as the discount rate, rather than the cost of capital (or weighted average cost of capital, WACC) which accounts for debt. In this calculation we've used 4.5%, which is based on a levered beta of 0.847. Beta is a measure of a stock's volatility, compared to the market as a whole. We get our beta from the industry average beta of globally comparable companies, with an imposed limit between 0.8 and 2.0, which is a reasonable range for a stable business.
SWOT Analysis for Carta Holdings
- Currently debt free.
- Dividend is in the top 25% of dividend payers in the market.
- No major weaknesses identified for 3688.
- Expected to breakeven next year.
- Has sufficient cash runway for more than 3 years based on current free cash flows.
- Good value based on P/S ratio compared to estimated Fair P/S ratio.
- Dividends are not covered by cash flow.
Moving On:
Valuation is only one side of the coin in terms of building your investment thesis, and it shouldn't be the only metric you look at when researching a company. The DCF model is not a perfect stock valuation tool. Preferably you'd apply different cases and assumptions and see how they would impact the company's valuation. For example, changes in the company's cost of equity or the risk free rate can significantly impact the valuation. For Carta Holdings, we've put together three essential aspects you should assess:
- Risks: For instance, we've identified 1 warning sign for Carta Holdings that you should be aware of.
- Future Earnings: How does 3688's growth rate compare to its peers and the wider market? Dig deeper into the analyst consensus number for the upcoming years by interacting with our free analyst growth expectation chart.
- Other Solid Businesses: Low debt, high returns on equity and good past performance are fundamental to a strong business. Why not explore our interactive list of stocks with solid business fundamentals to see if there are other companies you may not have considered!
PS. The Simply Wall St app conducts a discounted cash flow valuation for every stock on the TSE every day. If you want to find the calculation for other stocks just search here.
New: AI Stock Screener & Alerts
Our new AI Stock Screener scans the market every day to uncover opportunities.
• Dividend Powerhouses (3%+ Yield)
• Undervalued Small Caps with Insider Buying
• High growth Tech and AI Companies
Or build your own from over 50 metrics.
Have feedback on this article? Concerned about the content? Get in touch with us directly. Alternatively, email editorial-team (at) simplywallst.com.
This article by Simply Wall St is general in nature. We provide commentary based on historical data and analyst forecasts only using an unbiased methodology and our articles are not intended to be financial advice. It does not constitute a recommendation to buy or sell any stock, and does not take account of your objectives, or your financial situation. We aim to bring you long-term focused analysis driven by fundamental data. Note that our analysis may not factor in the latest price-sensitive company announcements or qualitative material. Simply Wall St has no position in any stocks mentioned.
Have feedback on this article? Concerned about the content? Get in touch with us directly. Alternatively, email editorial-team@simplywallst.com
About TSE:3688
Carta Holdings
Engages in the digital marketing/internet-related service business in Japan.
Flawless balance sheet and fair value.
Market Insights

Community Narratives

