With A 44% Price Drop For DLE Inc. (TSE:3686) You'll Still Get What You Pay For


The DLE Inc. (TSE:3686) share price has fared very poorly over the last month, falling by a substantial 44%. The recent drop completes a disastrous twelve months for shareholders, who are sitting on a 66% loss during that time.
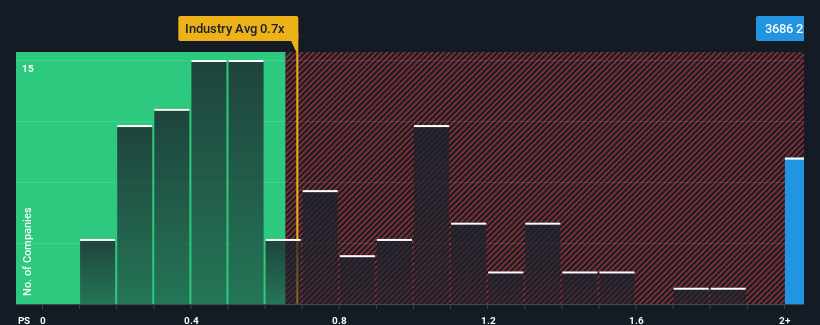
Although its price has dipped substantially, given close to half the companies operating in Japan's Media industry have price-to-sales ratios (or "P/S") below 0.7x, you may still consider DLE as a stock to potentially avoid with its 2.3x P/S ratio. Nonetheless, we'd need to dig a little deeper to determine if there is a rational basis for the elevated P/S.
See our latest analysis for DLE
What Does DLE's Recent Performance Look Like?
For example, consider that DLE's financial performance has been poor lately as its revenue has been in decline. One possibility is that the P/S is high because investors think the company will still do enough to outperform the broader industry in the near future. If not, then existing shareholders may be quite nervous about the viability of the share price.
Want the full picture on earnings, revenue and cash flow for the company? Then our free report on DLE will help you shine a light on its historical performance.What Are Revenue Growth Metrics Telling Us About The High P/S?
There's an inherent assumption that a company should outperform the industry for P/S ratios like DLE's to be considered reasonable.
Retrospectively, the last year delivered a frustrating 16% decrease to the company's top line. However, a few very strong years before that means that it was still able to grow revenue by an impressive 53% in total over the last three years. Although it's been a bumpy ride, it's still fair to say the revenue growth recently has been more than adequate for the company.
Comparing that to the industry, which is only predicted to deliver 3.9% growth in the next 12 months, the company's momentum is stronger based on recent medium-term annualised revenue results.
With this in consideration, it's not hard to understand why DLE's P/S is high relative to its industry peers. It seems most investors are expecting this strong growth to continue and are willing to pay more for the stock.
The Key Takeaway
Despite the recent share price weakness, DLE's P/S remains higher than most other companies in the industry. It's argued the price-to-sales ratio is an inferior measure of value within certain industries, but it can be a powerful business sentiment indicator.
As we suspected, our examination of DLE revealed its three-year revenue trends are contributing to its high P/S, given they look better than current industry expectations. At this stage investors feel the potential continued revenue growth in the future is great enough to warrant an inflated P/S. Unless the recent medium-term conditions change, they will continue to provide strong support to the share price.
We don't want to rain on the parade too much, but we did also find 3 warning signs for DLE (2 are significant!) that you need to be mindful of.
Of course, profitable companies with a history of great earnings growth are generally safer bets. So you may wish to see this free collection of other companies that have reasonable P/E ratios and have grown earnings strongly.
New: Manage All Your Stock Portfolios in One Place
We've created the ultimate portfolio companion for stock investors, and it's free.
• Connect an unlimited number of Portfolios and see your total in one currency
• Be alerted to new Warning Signs or Risks via email or mobile
• Track the Fair Value of your stocks
Have feedback on this article? Concerned about the content? Get in touch with us directly. Alternatively, email editorial-team (at) simplywallst.com.
This article by Simply Wall St is general in nature. We provide commentary based on historical data and analyst forecasts only using an unbiased methodology and our articles are not intended to be financial advice. It does not constitute a recommendation to buy or sell any stock, and does not take account of your objectives, or your financial situation. We aim to bring you long-term focused analysis driven by fundamental data. Note that our analysis may not factor in the latest price-sensitive company announcements or qualitative material. Simply Wall St has no position in any stocks mentioned.
Have feedback on this article? Concerned about the content? Get in touch with us directly. Alternatively, email editorial-team@simplywallst.com
About TSE:3686
Flawless balance sheet low.
Market Insights

Community Narratives
