Stock Analysis
Investors three-year losses continue as FP (TSE:7947) dips a further 4.0% this week, earnings continue to decline


Many investors define successful investing as beating the market average over the long term. But if you try your hand at stock picking, you risk returning less than the market. Unfortunately, that's been the case for longer term FP Corporation (TSE:7947) shareholders, since the share price is down 40% in the last three years, falling well short of the market return of around 47%.
Since FP has shed JP¥8.7b from its value in the past 7 days, let's see if the longer term decline has been driven by the business' economics.
See our latest analysis for FP
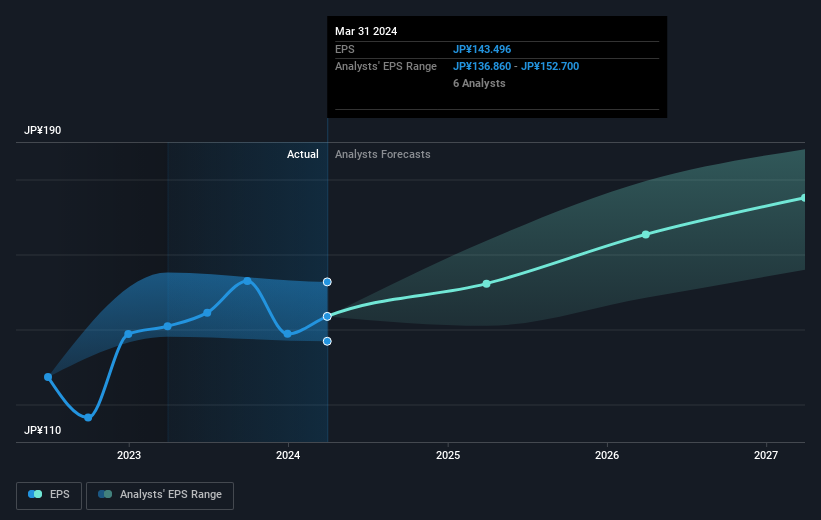
To paraphrase Benjamin Graham: Over the short term the market is a voting machine, but over the long term it's a weighing machine. By comparing earnings per share (EPS) and share price changes over time, we can get a feel for how investor attitudes to a company have morphed over time.
FP saw its EPS decline at a compound rate of 0.6% per year, over the last three years. This reduction in EPS is slower than the 16% annual reduction in the share price. So it seems the market was too confident about the business, in the past.
The graphic below depicts how EPS has changed over time (unveil the exact values by clicking on the image).
Before buying or selling a stock, we always recommend a close examination of historic growth trends, available here.
What About Dividends?
When looking at investment returns, it is important to consider the difference between total shareholder return (TSR) and share price return. Whereas the share price return only reflects the change in the share price, the TSR includes the value of dividends (assuming they were reinvested) and the benefit of any discounted capital raising or spin-off. It's fair to say that the TSR gives a more complete picture for stocks that pay a dividend. We note that for FP the TSR over the last 3 years was -37%, which is better than the share price return mentioned above. And there's no prize for guessing that the dividend payments largely explain the divergence!
A Different Perspective
Investors in FP had a tough year, with a total loss of 8.6% (including dividends), against a market gain of about 28%. However, keep in mind that even the best stocks will sometimes underperform the market over a twelve month period. Regrettably, last year's performance caps off a bad run, with the shareholders facing a total loss of 3% per year over five years. We realise that Baron Rothschild has said investors should "buy when there is blood on the streets", but we caution that investors should first be sure they are buying a high quality business. It's always interesting to track share price performance over the longer term. But to understand FP better, we need to consider many other factors. For instance, we've identified 2 warning signs for FP that you should be aware of.
We will like FP better if we see some big insider buys. While we wait, check out this free list of undervalued stocks (mostly small caps) with considerable, recent, insider buying.
Please note, the market returns quoted in this article reflect the market weighted average returns of stocks that currently trade on Japanese exchanges.
New: AI Stock Screener & Alerts
Our new AI Stock Screener scans the market every day to uncover opportunities.
• Dividend Powerhouses (3%+ Yield)
• Undervalued Small Caps with Insider Buying
• High growth Tech and AI Companies
Or build your own from over 50 metrics.
Have feedback on this article? Concerned about the content? Get in touch with us directly. Alternatively, email editorial-team (at) simplywallst.com.
This article by Simply Wall St is general in nature. We provide commentary based on historical data and analyst forecasts only using an unbiased methodology and our articles are not intended to be financial advice. It does not constitute a recommendation to buy or sell any stock, and does not take account of your objectives, or your financial situation. We aim to bring you long-term focused analysis driven by fundamental data. Note that our analysis may not factor in the latest price-sensitive company announcements or qualitative material. Simply Wall St has no position in any stocks mentioned.
About TSE:7947
FP
Manufactures and markets polystyrene and compound resin disposable food containers in Japan.
Excellent balance sheet average dividend payer.
