
Advertisement
Warren Buffett famously said, 'Volatility is far from synonymous with risk.' So it seems the smart money knows that debt - which is usually involved in bankruptcies - is a very important factor, when you assess how risky a company is. We note that NSK Ltd. (TSE:6471) does have debt on its balance sheet. But the more important question is: how much risk is that debt creating?
Why Does Debt Bring Risk?
Generally speaking, debt only becomes a real problem when a company can't easily pay it off, either by raising capital or with its own cash flow. In the worst case scenario, a company can go bankrupt if it cannot pay its creditors. However, a more common (but still painful) scenario is that it has to raise new equity capital at a low price, thus permanently diluting shareholders. By replacing dilution, though, debt can be an extremely good tool for businesses that need capital to invest in growth at high rates of return. When we examine debt levels, we first consider both cash and debt levels, together.
See our latest analysis for NSK
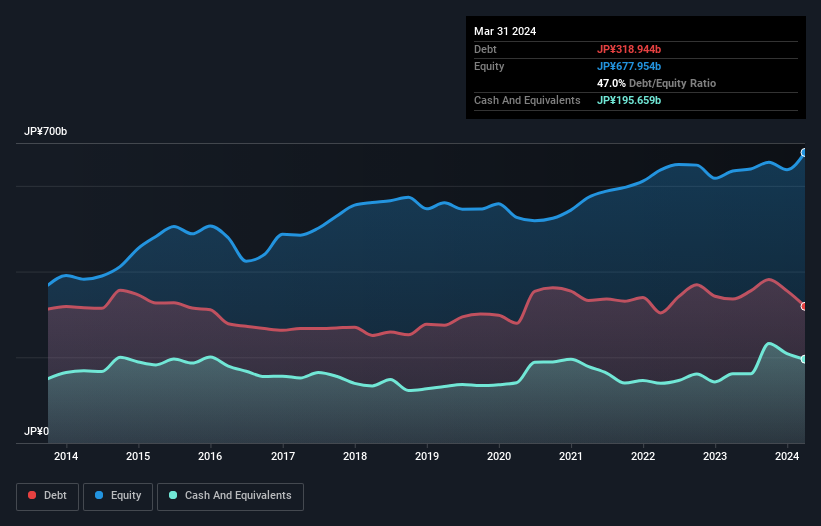
How Much Debt Does NSK Carry?
You can click the graphic below for the historical numbers, but it shows that NSK had JP¥318.9b of debt in March 2024, down from JP¥335.7b, one year before. However, it also had JP¥195.7b in cash, and so its net debt is JP¥123.3b.
A Look At NSK's Liabilities
The latest balance sheet data shows that NSK had liabilities of JP¥347.8b due within a year, and liabilities of JP¥272.3b falling due after that. Offsetting these obligations, it had cash of JP¥195.7b as well as receivables valued at JP¥225.2b due within 12 months. So its liabilities total JP¥199.2b more than the combination of its cash and short-term receivables.
While this might seem like a lot, it is not so bad since NSK has a market capitalization of JP¥379.8b, and so it could probably strengthen its balance sheet by raising capital if it needed to. But we definitely want to keep our eyes open to indications that its debt is bringing too much risk.
In order to size up a company's debt relative to its earnings, we calculate its net debt divided by its earnings before interest, tax, depreciation, and amortization (EBITDA) and its earnings before interest and tax (EBIT) divided by its interest expense (its interest cover). Thus we consider debt relative to earnings both with and without depreciation and amortization expenses.
NSK's net debt to EBITDA ratio of about 1.6 suggests only moderate use of debt. And its strong interest cover of 11.4 times, makes us even more comfortable. In fact NSK's saving grace is its low debt levels, because its EBIT has tanked 25% in the last twelve months. When a company sees its earnings tank, it can sometimes find its relationships with its lenders turn sour. When analysing debt levels, the balance sheet is the obvious place to start. But it is future earnings, more than anything, that will determine NSK's ability to maintain a healthy balance sheet going forward. So if you want to see what the professionals think, you might find this free report on analyst profit forecasts to be interesting.
Finally, while the tax-man may adore accounting profits, lenders only accept cold hard cash. So the logical step is to look at the proportion of that EBIT that is matched by actual free cash flow. In the last three years, NSK's free cash flow amounted to 49% of its EBIT, less than we'd expect. That's not great, when it comes to paying down debt.
Our View
NSK's struggle to grow its EBIT had us second guessing its balance sheet strength, but the other data-points we considered were relatively redeeming. In particular, its interest cover was re-invigorating. When we consider all the factors discussed, it seems to us that NSK is taking some risks with its use of debt. While that debt can boost returns, we think the company has enough leverage now. There's no doubt that we learn most about debt from the balance sheet. However, not all investment risk resides within the balance sheet - far from it. For instance, we've identified 1 warning sign for NSK that you should be aware of.
If you're interested in investing in businesses that can grow profits without the burden of debt, then check out this free list of growing businesses that have net cash on the balance sheet.
Valuation is complex, but we're here to simplify it.
Discover if NSK might be undervalued or overvalued with our detailed analysis, featuring fair value estimates, potential risks, dividends, insider trades, and its financial condition.
Access Free AnalysisHave feedback on this article? Concerned about the content? Get in touch with us directly. Alternatively, email editorial-team (at) simplywallst.com.
This article by Simply Wall St is general in nature. We provide commentary based on historical data and analyst forecasts only using an unbiased methodology and our articles are not intended to be financial advice. It does not constitute a recommendation to buy or sell any stock, and does not take account of your objectives, or your financial situation. We aim to bring you long-term focused analysis driven by fundamental data. Note that our analysis may not factor in the latest price-sensitive company announcements or qualitative material. Simply Wall St has no position in any stocks mentioned.
Have feedback on this article? Concerned about the content? Get in touch with us directly. Alternatively, email editorial-team@simplywallst.com
About TSE:6471
NSK
Manufactures and sells industrial machinery bearings, automotive products, and precision machinery and parts worldwide.
Flawless balance sheet average dividend payer.
Similar Companies
Market Insights

Advertisement
Community Narratives
The company that turned a verb into a global necessity and basically runs the modern internet, digital ads, smartphones, maps, and AI.
Fair Value US$300.00|10.8% undervalued
OS
Community Contributor
Flowers Foods Pays A Fair Price For Health
Fair Value US$16.12|22.0% undervalued
NV
Community Contributor
TMX Group will thrive with 33.3% profit margin and enduring market moat
Fair Value CA$49.90|3.8% overvalued
LI
Community Contributor