Advertisement
- Taiwan
- /
- Aerospace & Defense
- /
- TWSE:2645
Asian Market Value Stock Picks For Estimated Undervaluation

Simply Wall St
Reviewed by Simply Wall St
As global trade discussions continue to shape market sentiment, Asian markets have shown resilience, with key indices in China and Japan posting gains amid hopes for easing trade tensions. In this environment of cautious optimism, identifying undervalued stocks becomes crucial for investors seeking opportunities; these stocks often possess strong fundamentals that may not yet be fully recognized by the market.
Top 10 Undervalued Stocks Based On Cash Flows In Asia
| Name | Current Price | Fair Value (Est) | Discount (Est) |
| PixArt Imaging (TPEX:3227) | NT$221.50 | NT$439.89 | 49.6% |
| Ficont Industry (Beijing) (SHSE:605305) | CN¥26.49 | CN¥52.54 | 49.6% |
| Shenzhen KSTAR Science and Technology (SZSE:002518) | CN¥22.82 | CN¥44.80 | 49.1% |
| People & Technology (KOSDAQ:A137400) | ₩37700.00 | ₩73423.22 | 48.7% |
| Shenzhen Yinghe Technology (SZSE:300457) | CN¥17.60 | CN¥34.34 | 48.7% |
| Dive (TSE:151A) | ¥931.00 | ¥1852.82 | 49.8% |
| Heartland Group Holdings (NZSE:HGH) | NZ$0.84 | NZ$1.64 | 48.9% |
| BalnibarbiLtd (TSE:3418) | ¥1163.00 | ¥2317.93 | 49.8% |
| Wenzhou Yihua Connector (SZSE:002897) | CN¥39.84 | CN¥77.92 | 48.9% |
| HanJung Natural Connectivity System.co.Ltd (KOSDAQ:A107640) | ₩28000.00 | ₩55868.52 | 49.9% |
Here's a peek at a few of the choices from the screener.
SAMG Entertainment (KOSDAQ:A419530)
Overview: SAMG Entertainment Co., Ltd. is involved in the production of TV series, animated feature films, advertisements, and games globally, with a market cap of ₩503.71 billion.
Operations: The company's revenue is primarily derived from its computer graphics segment, generating ₩116.44 million.
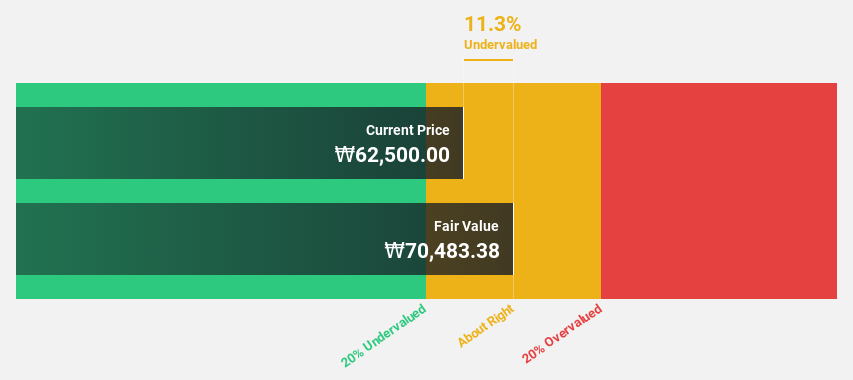
Estimated Discount To Fair Value: 12.2%
SAMG Entertainment is trading at ₩62,000, 12.2% below its estimated fair value of ₩70,576.52, indicating potential undervaluation based on cash flows. Despite recent share price volatility and revenue growth of 22.4% last year, it's expected to become profitable within three years with earnings projected to grow significantly at 107.85% annually. The company's forecasted return on equity is high at 34.4%, suggesting strong future financial performance relative to benchmarks.
- Our expertly prepared growth report on SAMG Entertainment implies its future financial outlook may be stronger than recent results.
- Take a closer look at SAMG Entertainment's balance sheet health here in our report.
Tokai Carbon (TSE:5301)
Overview: Tokai Carbon Co., Ltd. is a Japanese company that manufactures and sells carbon-related products and services, with a market cap of ¥210.99 billion.
Operations: The company's revenue segments include Fine Carbon at ¥54.09 billion, Graphite Electrodes at ¥49.07 billion, Smelting and Lining at ¥64.79 billion, Carbon Black Business at ¥156.82 billion, and Industrial Furnaces and Related Products at ¥16.96 billion.
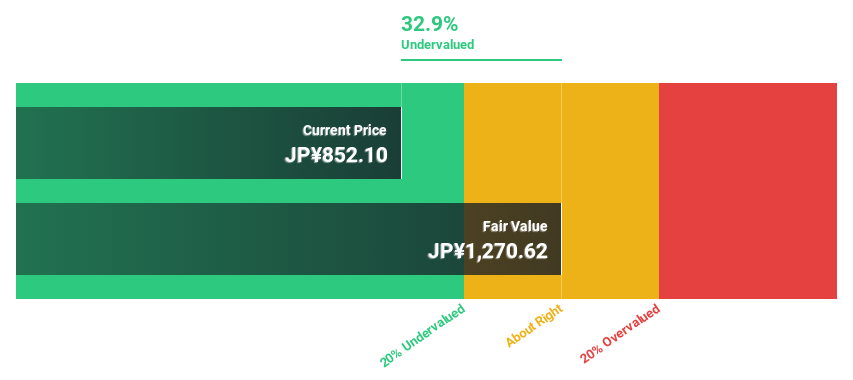
Estimated Discount To Fair Value: 18.6%
Tokai Carbon, trading at ¥988.4, is priced 18.6% below its estimated fair value of ¥1,214.36, reflecting potential undervaluation based on cash flows. Despite a low forecasted return on equity of 7.8% in three years and slower revenue growth at 4.9% annually compared to the market average, it is expected to achieve profitability within the same timeframe with above-average profit growth projections and a dividend yield of 3.04%.
- Upon reviewing our latest growth report, Tokai Carbon's projected financial performance appears quite optimistic.
- Click here and access our complete balance sheet health report to understand the dynamics of Tokai Carbon.
Evergreen Aviation Technologies (TWSE:2645)
Overview: Evergreen Aviation Technologies Corporation offers aircraft maintenance services to airline partners both in Taiwan and internationally, with a market cap of NT$42.89 billion.
Operations: The company generates revenue primarily through its aircraft maintenance services provided to airline partners in Taiwan and abroad.
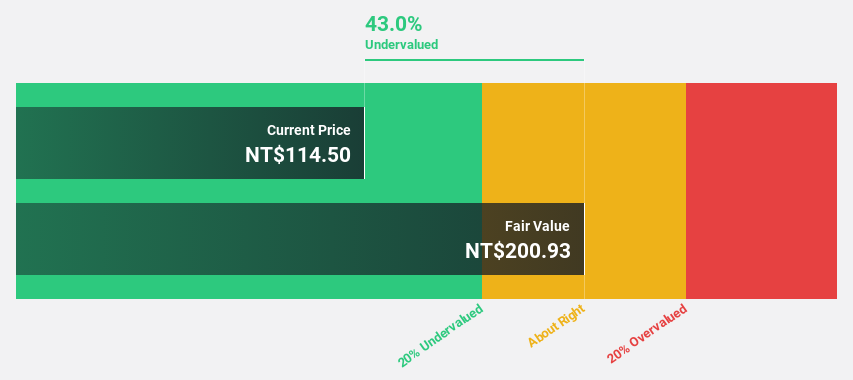
Estimated Discount To Fair Value: 43.1%
Evergreen Aviation Technologies, trading at NT$114.5, is significantly undervalued compared to its estimated fair value of NT$201.3. The company's earnings are expected to grow substantially at 24.31% annually, outpacing the Taiwan market's average growth rate. Despite this growth potential, its dividend yield of 3.93% is not well supported by earnings or free cash flows. Recent quarterly results showed increased sales and net income year-over-year, highlighting positive operational performance trends.
- In light of our recent growth report, it seems possible that Evergreen Aviation Technologies' financial performance will exceed current levels.
- Navigate through the intricacies of Evergreen Aviation Technologies with our comprehensive financial health report here.
Turning Ideas Into Actions
- Get an in-depth perspective on all 289 Undervalued Asian Stocks Based On Cash Flows by using our screener here.
- Are these companies part of your investment strategy? Use Simply Wall St to consolidate your holdings into a portfolio and gain insights with our comprehensive analysis tools.
- Unlock the power of informed investing with Simply Wall St, your free guide to navigating stock markets worldwide.
Looking For Alternative Opportunities?
- Explore high-performing small cap companies that haven't yet garnered significant analyst attention.
- Diversify your portfolio with solid dividend payers offering reliable income streams to weather potential market turbulence.
- Fuel your portfolio with companies showing strong growth potential, backed by optimistic outlooks both from analysts and management.
This article by Simply Wall St is general in nature. We provide commentary based on historical data and analyst forecasts only using an unbiased methodology and our articles are not intended to be financial advice. It does not constitute a recommendation to buy or sell any stock, and does not take account of your objectives, or your financial situation. We aim to bring you long-term focused analysis driven by fundamental data. Note that our analysis may not factor in the latest price-sensitive company announcements or qualitative material. Simply Wall St has no position in any stocks mentioned.
Valuation is complex, but we're here to simplify it.
Discover if Evergreen Aviation Technologies might be undervalued or overvalued with our detailed analysis, featuring fair value estimates, potential risks, dividends, insider trades, and its financial condition.
Access Free AnalysisHave feedback on this article? Concerned about the content? Get in touch with us directly. Alternatively, email editorial-team@simplywallst.com
About TWSE:2645
Evergreen Aviation Technologies
Provides aircraft maintenance services to airline partners in Taiwan and internationally.
Flawless balance sheet and undervalued.
Market Insights

Advertisement
Community Narratives
A formidable player in AI and enterprise computing.
Fair Value US$210.00|3.9% overvalued
CO
Community Contributor
IREN's Bold Moves in Sustainable Bitcoin Mining & AI Data Centers
Fair Value US$89.00|21.8% undervalued
BL
Community Contributor
Cooling the Champions: The Aussie Tech Behind F1's Victories
Fair Value AU$12.40|40.6% undervalued
TR
Community Contributor