Ishizuka Glass Co., Ltd.'s (TSE:5204) 27% Share Price Plunge Could Signal Some Risk

The Ishizuka Glass Co., Ltd. (TSE:5204) share price has fared very poorly over the last month, falling by a substantial 27%. Indeed, the recent drop has reduced its annual gain to a relatively sedate 5.4% over the last twelve months.
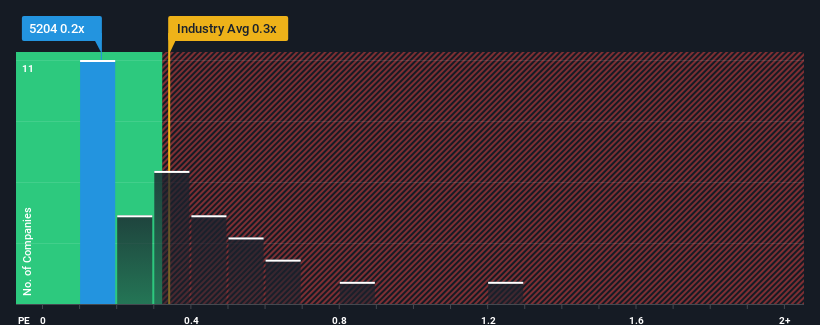
Although its price has dipped substantially, you could still be forgiven for feeling indifferent about Ishizuka Glass' P/S ratio of 0.2x, since the median price-to-sales (or "P/S") ratio for the Packaging industry in Japan is also close to 0.3x. Although, it's not wise to simply ignore the P/S without explanation as investors may be disregarding a distinct opportunity or a costly mistake.
See our latest analysis for Ishizuka Glass
What Does Ishizuka Glass' P/S Mean For Shareholders?
We'd have to say that with no tangible growth over the last year, Ishizuka Glass' revenue has been unimpressive. It might be that many expect the uninspiring revenue performance to only match most other companies at best over the coming period, which has kept the P/S from rising. Those who are bullish on Ishizuka Glass will be hoping that this isn't the case, so that they can pick up the stock at a lower valuation.
Want the full picture on earnings, revenue and cash flow for the company? Then our free report on Ishizuka Glass will help you shine a light on its historical performance.How Is Ishizuka Glass' Revenue Growth Trending?
There's an inherent assumption that a company should be matching the industry for P/S ratios like Ishizuka Glass' to be considered reasonable.
If we review the last year of revenue, the company posted a result that saw barely any deviation from a year ago. Whilst it's an improvement, it wasn't enough to get the company out of the hole it was in, with revenue down 15% overall from three years ago. So unfortunately, we have to acknowledge that the company has not done a great job of growing revenue over that time.
Weighing that medium-term revenue trajectory against the broader industry's one-year forecast for expansion of 26% shows it's an unpleasant look.
With this in mind, we find it worrying that Ishizuka Glass' P/S exceeds that of its industry peers. It seems most investors are ignoring the recent poor growth rate and are hoping for a turnaround in the company's business prospects. Only the boldest would assume these prices are sustainable as a continuation of recent revenue trends is likely to weigh on the share price eventually.
The Bottom Line On Ishizuka Glass' P/S
Ishizuka Glass' plummeting stock price has brought its P/S back to a similar region as the rest of the industry. While the price-to-sales ratio shouldn't be the defining factor in whether you buy a stock or not, it's quite a capable barometer of revenue expectations.
The fact that Ishizuka Glass currently trades at a P/S on par with the rest of the industry is surprising to us since its recent revenues have been in decline over the medium-term, all while the industry is set to grow. When we see revenue heading backwards in the context of growing industry forecasts, it'd make sense to expect a possible share price decline on the horizon, sending the moderate P/S lower. Unless the the circumstances surrounding the recent medium-term improve, it wouldn't be wrong to expect a a difficult period ahead for the company's shareholders.
And what about other risks? Every company has them, and we've spotted 4 warning signs for Ishizuka Glass (of which 1 is significant!) you should know about.
If you're unsure about the strength of Ishizuka Glass' business, why not explore our interactive list of stocks with solid business fundamentals for some other companies you may have missed.
If you're looking to trade Ishizuka Glass, open an account with the lowest-cost platform trusted by professionals, Interactive Brokers.
With clients in over 200 countries and territories, and access to 160 markets, IBKR lets you trade stocks, options, futures, forex, bonds and funds from a single integrated account.
Enjoy no hidden fees, no account minimums, and FX conversion rates as low as 0.03%, far better than what most brokers offer.
Sponsored ContentNew: AI Stock Screener & Alerts
Our new AI Stock Screener scans the market every day to uncover opportunities.
• Dividend Powerhouses (3%+ Yield)
• Undervalued Small Caps with Insider Buying
• High growth Tech and AI Companies
Or build your own from over 50 metrics.
Have feedback on this article? Concerned about the content? Get in touch with us directly. Alternatively, email editorial-team (at) simplywallst.com.
This article by Simply Wall St is general in nature. We provide commentary based on historical data and analyst forecasts only using an unbiased methodology and our articles are not intended to be financial advice. It does not constitute a recommendation to buy or sell any stock, and does not take account of your objectives, or your financial situation. We aim to bring you long-term focused analysis driven by fundamental data. Note that our analysis may not factor in the latest price-sensitive company announcements or qualitative material. Simply Wall St has no position in any stocks mentioned.
Have feedback on this article? Concerned about the content? Get in touch with us directly. Alternatively, email editorial-team@simplywallst.com
About TSE:5204
Ishizuka Glass
Produces and distributes glass bottles and tableware, paper packaging products, plastic containers, and ceramic products in Japan and internationally.
Adequate balance sheet slight.
Market Insights

Community Narratives

