
Advertisement
Are Robust Financials Driving The Recent Rally In MEC Company Ltd.'s (TSE:4971) Stock?
MEC (TSE:4971) has had a great run on the share market with its stock up by a significant 10% over the last week. Given the company's impressive performance, we decided to study its financial indicators more closely as a company's financial health over the long-term usually dictates market outcomes. Particularly, we will be paying attention to MEC's ROE today.
Return on Equity or ROE is a test of how effectively a company is growing its value and managing investors’ money. In simpler terms, it measures the profitability of a company in relation to shareholder's equity.
Check out our latest analysis for MEC
How Is ROE Calculated?
Return on equity can be calculated by using the formula:
Return on Equity = Net Profit (from continuing operations) ÷ Shareholders' Equity
So, based on the above formula, the ROE for MEC is:
9.3% = JP¥2.3b ÷ JP¥25b (Based on the trailing twelve months to December 2023).
The 'return' is the yearly profit. That means that for every ¥1 worth of shareholders' equity, the company generated ¥0.09 in profit.
What Is The Relationship Between ROE And Earnings Growth?
We have already established that ROE serves as an efficient profit-generating gauge for a company's future earnings. Based on how much of its profits the company chooses to reinvest or "retain", we are then able to evaluate a company's future ability to generate profits. Assuming everything else remains unchanged, the higher the ROE and profit retention, the higher the growth rate of a company compared to companies that don't necessarily bear these characteristics.
MEC's Earnings Growth And 9.3% ROE
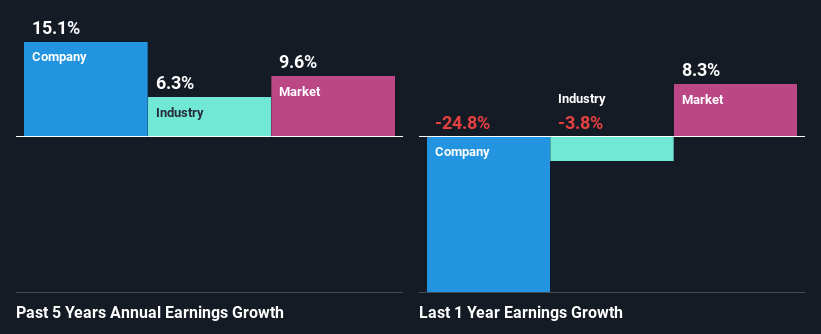
To begin with, MEC seems to have a respectable ROE. Especially when compared to the industry average of 6.6% the company's ROE looks pretty impressive. This certainly adds some context to MEC's decent 15% net income growth seen over the past five years.
As a next step, we compared MEC's net income growth with the industry, and pleasingly, we found that the growth seen by the company is higher than the average industry growth of 6.3%.
The basis for attaching value to a company is, to a great extent, tied to its earnings growth. What investors need to determine next is if the expected earnings growth, or the lack of it, is already built into the share price. Doing so will help them establish if the stock's future looks promising or ominous. What is 4971 worth today? The intrinsic value infographic in our free research report helps visualize whether 4971 is currently mispriced by the market.
Is MEC Using Its Retained Earnings Effectively?
MEC has a healthy combination of a moderate three-year median payout ratio of 26% (or a retention ratio of 74%) and a respectable amount of growth in earnings as we saw above, meaning that the company has been making efficient use of its profits.
Additionally, MEC has paid dividends over a period of at least ten years which means that the company is pretty serious about sharing its profits with shareholders.
Summary
In total, we are pretty happy with MEC's performance. Specifically, we like that the company is reinvesting a huge chunk of its profits at a high rate of return. This of course has caused the company to see substantial growth in its earnings. With that said, the latest industry analyst forecasts reveal that the company's earnings are expected to accelerate. To know more about the latest analysts predictions for the company, check out this visualization of analyst forecasts for the company.
New: Manage All Your Stock Portfolios in One Place
We've created the ultimate portfolio companion for stock investors, and it's free.
• Connect an unlimited number of Portfolios and see your total in one currency
• Be alerted to new Warning Signs or Risks via email or mobile
• Track the Fair Value of your stocks
Have feedback on this article? Concerned about the content? Get in touch with us directly. Alternatively, email editorial-team (at) simplywallst.com.
This article by Simply Wall St is general in nature. We provide commentary based on historical data and analyst forecasts only using an unbiased methodology and our articles are not intended to be financial advice. It does not constitute a recommendation to buy or sell any stock, and does not take account of your objectives, or your financial situation. We aim to bring you long-term focused analysis driven by fundamental data. Note that our analysis may not factor in the latest price-sensitive company announcements or qualitative material. Simply Wall St has no position in any stocks mentioned.
About TSE:4971
MEC
Engages in the research and development, production, and sale of chemicals, equipment, and related materials used in the production of printed circuit boards in Japan, Taiwan, Hong Kong, China, Thailand, and Europe.
Flawless balance sheet with reasonable growth potential.
Market Insights

Advertisement
Community Narratives
MicroVision will explode future revenue by 380.37% with a vision towards success
Fair Value US$60|98.4% undervalued
TH
Community Contributor
The Indispensable Artery for a New North American Economy
Fair Value CA$132.87|0.8% undervalued
TI
Community Contributor
Recently Updated Narratives
RE

RecMag on Proximus ·
Proximus: The State-Backed Backup Plan with 7% Gross Yield and 15% Currency Upside.
Fair Value:€17.1359.3% undervalued
29 followersusers have followed this narrative
0 commentsusers have commented on this narrative
0 likesusers have liked this narrative
SW

swift11 on DXC Technology ·
CEO: We are winners in the long term in the AI world
Fair Value:US$17.4624.9% undervalued
1 followerusers have followed this narrative
0 commentsusers have commented on this narrative
0 likesusers have liked this narrative
AL

AlexLovell on Rocket Lab ·
Early mover in a fast growing industry. Likely to experience share price volatility as they scale
Fair Value:US$16.25158.0% overvalued
2 followersusers have followed this narrative
0 commentsusers have commented on this narrative
0 likesusers have liked this narrative
Popular Narratives
TH

TheWallstreetKing on MicroVision ·
MicroVision will explode future revenue by 380.37% with a vision towards success
Fair Value:US$6098.4% undervalued
97 followersusers have followed this narrative
10 commentsusers have commented on this narrative
19 likesusers have liked this narrative
OS


oscargarcia on Alphabet ·
The company that turned a verb into a global necessity and basically runs the modern internet, digital ads, smartphones, maps, and AI.
Fair Value:US$3405.9% undervalued
137 followersusers have followed this narrative
6 commentsusers have commented on this narrative
18 likesusers have liked this narrative
AN


AnalystConsensusTarget on NVIDIA ·
NVDA: Expanding AI Demand Will Drive Major Data Center Investments Through 2026
Fair Value:US$232.7922.6% undervalued
929 followersusers have followed this narrative
6 commentsusers have commented on this narrative
22 likesusers have liked this narrative