Estimating The Fair Value Of Kawaguchi Chemical Industry Co., Ltd (TSE:4361)


Key Insights
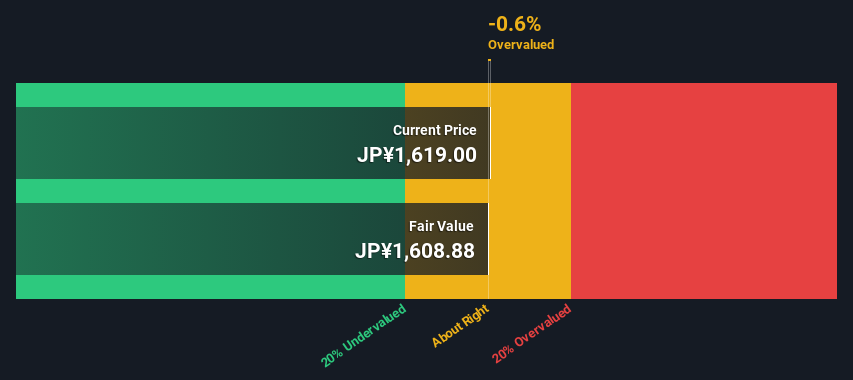
- The projected fair value for Kawaguchi Chemical Industry is JP¥1,609 based on 2 Stage Free Cash Flow to Equity
- Current share price of JP¥1,619 suggests Kawaguchi Chemical Industry is potentially trading close to its fair value
- Industry average of 8.3% suggests Kawaguchi Chemical Industry's peers are currently trading at a higher premium to fair value
How far off is Kawaguchi Chemical Industry Co., Ltd (TSE:4361) from its intrinsic value? Using the most recent financial data, we'll take a look at whether the stock is fairly priced by taking the expected future cash flows and discounting them to their present value. We will use the Discounted Cash Flow (DCF) model on this occasion. Before you think you won't be able to understand it, just read on! It's actually much less complex than you'd imagine.
We generally believe that a company's value is the present value of all of the cash it will generate in the future. However, a DCF is just one valuation metric among many, and it is not without flaws. For those who are keen learners of equity analysis, the Simply Wall St analysis model here may be something of interest to you.
Check out our latest analysis for Kawaguchi Chemical Industry
The Model
We use what is known as a 2-stage model, which simply means we have two different periods of growth rates for the company's cash flows. Generally the first stage is higher growth, and the second stage is a lower growth phase. To begin with, we have to get estimates of the next ten years of cash flows. Seeing as no analyst estimates of free cash flow are available to us, we have extrapolate the previous free cash flow (FCF) from the company's last reported value. We assume companies with shrinking free cash flow will slow their rate of shrinkage, and that companies with growing free cash flow will see their growth rate slow, over this period. We do this to reflect that growth tends to slow more in the early years than it does in later years.
A DCF is all about the idea that a dollar in the future is less valuable than a dollar today, so we need to discount the sum of these future cash flows to arrive at a present value estimate:
10-year free cash flow (FCF) estimate
| 2025 | 2026 | 2027 | 2028 | 2029 | 2030 | 2031 | 2032 | 2033 | 2034 | |
| Levered FCF (¥, Millions) | JP¥169.1m | JP¥173.8m | JP¥177.3m | JP¥179.9m | JP¥181.8m | JP¥183.3m | JP¥184.5m | JP¥185.4m | JP¥186.1m | JP¥186.8m |
| Growth Rate Estimate Source | Est @ 3.89% | Est @ 2.78% | Est @ 2.01% | Est @ 1.46% | Est @ 1.09% | Est @ 0.82% | Est @ 0.63% | Est @ 0.50% | Est @ 0.41% | Est @ 0.35% |
| Present Value (¥, Millions) Discounted @ 9.6% | JP¥154 | JP¥145 | JP¥135 | JP¥125 | JP¥115 | JP¥106 | JP¥97.4 | JP¥89.3 | JP¥81.9 | JP¥75.0 |
("Est" = FCF growth rate estimated by Simply Wall St)
Present Value of 10-year Cash Flow (PVCF) = JP¥1.1b
The second stage is also known as Terminal Value, this is the business's cash flow after the first stage. For a number of reasons a very conservative growth rate is used that cannot exceed that of a country's GDP growth. In this case we have used the 5-year average of the 10-year government bond yield (0.2%) to estimate future growth. In the same way as with the 10-year 'growth' period, we discount future cash flows to today's value, using a cost of equity of 9.6%.
Terminal Value (TV)= FCF2034 × (1 + g) ÷ (r – g) = JP¥187m× (1 + 0.2%) ÷ (9.6%– 0.2%) = JP¥2.0b
Present Value of Terminal Value (PVTV)= TV / (1 + r)10= JP¥2.0b÷ ( 1 + 9.6%)10= JP¥803m
The total value, or equity value, is then the sum of the present value of the future cash flows, which in this case is JP¥1.9b. In the final step we divide the equity value by the number of shares outstanding. Compared to the current share price of JP¥1.6k, the company appears around fair value at the time of writing. Valuations are imprecise instruments though, rather like a telescope - move a few degrees and end up in a different galaxy. Do keep this in mind.
Important Assumptions
The calculation above is very dependent on two assumptions. The first is the discount rate and the other is the cash flows. If you don't agree with these result, have a go at the calculation yourself and play with the assumptions. The DCF also does not consider the possible cyclicality of an industry, or a company's future capital requirements, so it does not give a full picture of a company's potential performance. Given that we are looking at Kawaguchi Chemical Industry as potential shareholders, the cost of equity is used as the discount rate, rather than the cost of capital (or weighted average cost of capital, WACC) which accounts for debt. In this calculation we've used 9.6%, which is based on a levered beta of 1.662. Beta is a measure of a stock's volatility, compared to the market as a whole. We get our beta from the industry average beta of globally comparable companies, with an imposed limit between 0.8 and 2.0, which is a reasonable range for a stable business.
SWOT Analysis for Kawaguchi Chemical Industry
- Earnings growth over the past year exceeded the industry.
- Debt is well covered by earnings.
- Dividends are covered by earnings and cash flows.
- Dividend is low compared to the top 25% of dividend payers in the Chemicals market.
- Current share price is below our estimate of fair value.
- Lack of analyst coverage makes it difficult to determine 4361's earnings prospects.
- Debt is not well covered by operating cash flow.
Moving On:
Whilst important, the DCF calculation ideally won't be the sole piece of analysis you scrutinize for a company. DCF models are not the be-all and end-all of investment valuation. Instead the best use for a DCF model is to test certain assumptions and theories to see if they would lead to the company being undervalued or overvalued. If a company grows at a different rate, or if its cost of equity or risk free rate changes sharply, the output can look very different. For Kawaguchi Chemical Industry, there are three pertinent factors you should look at:
- Risks: Take risks, for example - Kawaguchi Chemical Industry has 3 warning signs (and 1 which is potentially serious) we think you should know about.
- Other Solid Businesses: Low debt, high returns on equity and good past performance are fundamental to a strong business. Why not explore our interactive list of stocks with solid business fundamentals to see if there are other companies you may not have considered!
- Other Top Analyst Picks: Interested to see what the analysts are thinking? Take a look at our interactive list of analysts' top stock picks to find out what they feel might have an attractive future outlook!
PS. The Simply Wall St app conducts a discounted cash flow valuation for every stock on the TSE every day. If you want to find the calculation for other stocks just search here.
Valuation is complex, but we're here to simplify it.
Discover if Kawaguchi Chemical Industry might be undervalued or overvalued with our detailed analysis, featuring fair value estimates, potential risks, dividends, insider trades, and its financial condition.
Access Free AnalysisHave feedback on this article? Concerned about the content? Get in touch with us directly. Alternatively, email editorial-team (at) simplywallst.com.
This article by Simply Wall St is general in nature. We provide commentary based on historical data and analyst forecasts only using an unbiased methodology and our articles are not intended to be financial advice. It does not constitute a recommendation to buy or sell any stock, and does not take account of your objectives, or your financial situation. We aim to bring you long-term focused analysis driven by fundamental data. Note that our analysis may not factor in the latest price-sensitive company announcements or qualitative material. Simply Wall St has no position in any stocks mentioned.
Have feedback on this article? Concerned about the content? Get in touch with us directly. Alternatively, email editorial-team@simplywallst.com
About TSE:4361
Kawaguchi Chemical Industry
Manufactures and sells fine chemicals in Japan.
Solid track record with adequate balance sheet and pays a dividend.

