Kodama Chemical IndustryLtd (TSE:4222) Has A Somewhat Strained Balance Sheet


Legendary fund manager Li Lu (who Charlie Munger backed) once said, 'The biggest investment risk is not the volatility of prices, but whether you will suffer a permanent loss of capital.' When we think about how risky a company is, we always like to look at its use of debt, since debt overload can lead to ruin. Importantly, Kodama Chemical Industry Co.,Ltd. (TSE:4222) does carry debt. But the real question is whether this debt is making the company risky.
When Is Debt A Problem?
Debt is a tool to help businesses grow, but if a business is incapable of paying off its lenders, then it exists at their mercy. In the worst case scenario, a company can go bankrupt if it cannot pay its creditors. However, a more frequent (but still costly) occurrence is where a company must issue shares at bargain-basement prices, permanently diluting shareholders, just to shore up its balance sheet. Of course, plenty of companies use debt to fund growth, without any negative consequences. The first step when considering a company's debt levels is to consider its cash and debt together.
See our latest analysis for Kodama Chemical IndustryLtd
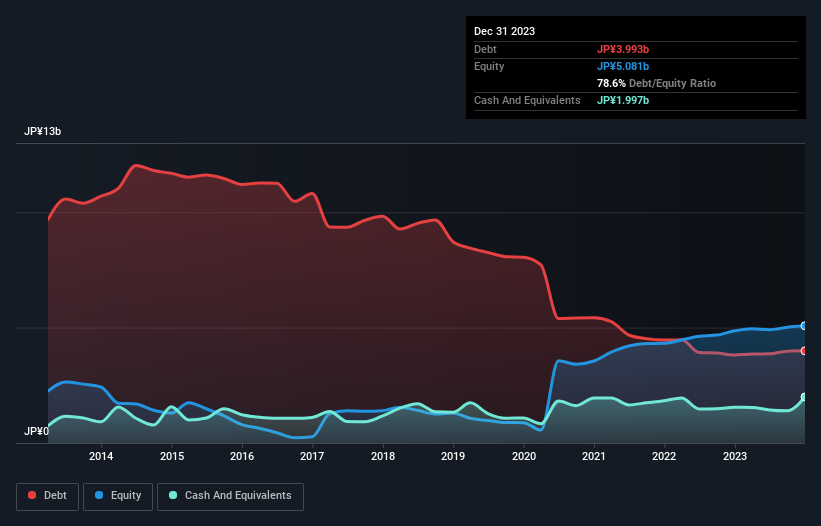
How Much Debt Does Kodama Chemical IndustryLtd Carry?
You can click the graphic below for the historical numbers, but it shows that as of December 2023 Kodama Chemical IndustryLtd had JP¥3.99b of debt, an increase on JP¥3.82b, over one year. However, it also had JP¥2.00b in cash, and so its net debt is JP¥2.00b.
How Strong Is Kodama Chemical IndustryLtd's Balance Sheet?
The latest balance sheet data shows that Kodama Chemical IndustryLtd had liabilities of JP¥6.59b due within a year, and liabilities of JP¥3.02b falling due after that. Offsetting these obligations, it had cash of JP¥2.00b as well as receivables valued at JP¥2.61b due within 12 months. So it has liabilities totalling JP¥5.01b more than its cash and near-term receivables, combined.
The deficiency here weighs heavily on the JP¥2.46b company itself, as if a child were struggling under the weight of an enormous back-pack full of books, his sports gear, and a trumpet. So we definitely think shareholders need to watch this one closely. At the end of the day, Kodama Chemical IndustryLtd would probably need a major re-capitalization if its creditors were to demand repayment.
We use two main ratios to inform us about debt levels relative to earnings. The first is net debt divided by earnings before interest, tax, depreciation, and amortization (EBITDA), while the second is how many times its earnings before interest and tax (EBIT) covers its interest expense (or its interest cover, for short). The advantage of this approach is that we take into account both the absolute quantum of debt (with net debt to EBITDA) and the actual interest expenses associated with that debt (with its interest cover ratio).
Kodama Chemical IndustryLtd's net debt is sitting at a very reasonable 2.4 times its EBITDA, while its EBIT covered its interest expense just 6.2 times last year. In large part that's due to the company's significant depreciation and amortisation charges, which arguably mean its EBITDA is a very generous measure of earnings, and its debt may be more of a burden than it first appears. Shareholders should be aware that Kodama Chemical IndustryLtd's EBIT was down 41% last year. If that decline continues then paying off debt will be harder than selling foie gras at a vegan convention. When analysing debt levels, the balance sheet is the obvious place to start. But it is Kodama Chemical IndustryLtd's earnings that will influence how the balance sheet holds up in the future. So when considering debt, it's definitely worth looking at the earnings trend. Click here for an interactive snapshot.
Finally, a business needs free cash flow to pay off debt; accounting profits just don't cut it. So we always check how much of that EBIT is translated into free cash flow. Over the last three years, Kodama Chemical IndustryLtd recorded free cash flow worth a fulsome 83% of its EBIT, which is stronger than we'd usually expect. That puts it in a very strong position to pay down debt.
Our View
To be frank both Kodama Chemical IndustryLtd's EBIT growth rate and its track record of staying on top of its total liabilities make us rather uncomfortable with its debt levels. But at least it's pretty decent at converting EBIT to free cash flow; that's encouraging. Overall, we think it's fair to say that Kodama Chemical IndustryLtd has enough debt that there are some real risks around the balance sheet. If all goes well, that should boost returns, but on the flip side, the risk of permanent capital loss is elevated by the debt. There's no doubt that we learn most about debt from the balance sheet. However, not all investment risk resides within the balance sheet - far from it. For example - Kodama Chemical IndustryLtd has 1 warning sign we think you should be aware of.
Of course, if you're the type of investor who prefers buying stocks without the burden of debt, then don't hesitate to discover our exclusive list of net cash growth stocks, today.
Valuation is complex, but we're here to simplify it.
Discover if Kodama Chemical IndustryLtd might be undervalued or overvalued with our detailed analysis, featuring fair value estimates, potential risks, dividends, insider trades, and its financial condition.
Access Free AnalysisHave feedback on this article? Concerned about the content? Get in touch with us directly. Alternatively, email editorial-team (at) simplywallst.com.
This article by Simply Wall St is general in nature. We provide commentary based on historical data and analyst forecasts only using an unbiased methodology and our articles are not intended to be financial advice. It does not constitute a recommendation to buy or sell any stock, and does not take account of your objectives, or your financial situation. We aim to bring you long-term focused analysis driven by fundamental data. Note that our analysis may not factor in the latest price-sensitive company announcements or qualitative material. Simply Wall St has no position in any stocks mentioned.
About TSE:4222
Kodama Chemical IndustryLtd
Manufactures and sells plastic products in Japan and internationally.
Excellent balance sheet and good value.
