
Advertisement

David Iben put it well when he said, 'Volatility is not a risk we care about. What we care about is avoiding the permanent loss of capital.' It's only natural to consider a company's balance sheet when you examine how risky it is, since debt is often involved when a business collapses. We can see that HOYA Corporation (TSE:7741) does use debt in its business. But is this debt a concern to shareholders?
When Is Debt Dangerous?
Debt is a tool to help businesses grow, but if a business is incapable of paying off its lenders, then it exists at their mercy. Part and parcel of capitalism is the process of 'creative destruction' where failed businesses are mercilessly liquidated by their bankers. However, a more usual (but still expensive) situation is where a company must dilute shareholders at a cheap share price simply to get debt under control. Of course, debt can be an important tool in businesses, particularly capital heavy businesses. When we examine debt levels, we first consider both cash and debt levels, together.
Check out our latest analysis for HOYA
What Is HOYA's Net Debt?
As you can see below, at the end of March 2024, HOYA had JP¥2.55b of debt, up from JP¥2.39b a year ago. Click the image for more detail. But on the other hand it also has JP¥544.4b in cash, leading to a JP¥541.9b net cash position.
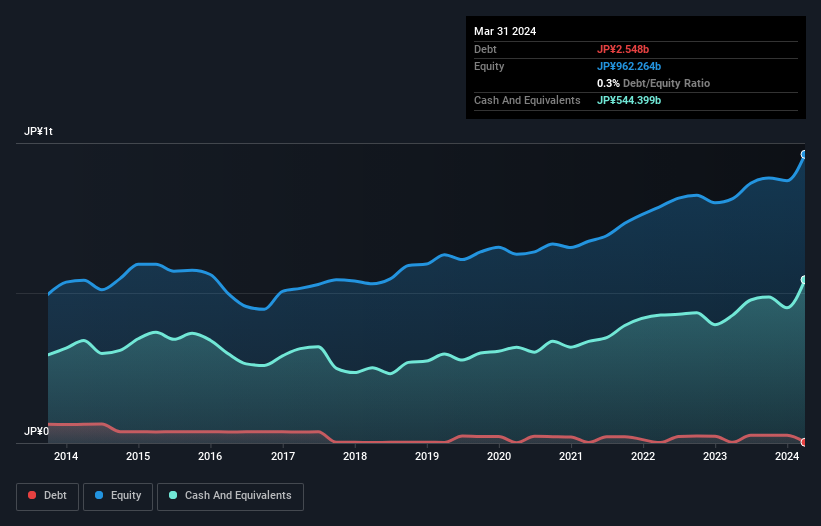
How Strong Is HOYA's Balance Sheet?
According to the last reported balance sheet, HOYA had liabilities of JP¥168.9b due within 12 months, and liabilities of JP¥72.5b due beyond 12 months. Offsetting these obligations, it had cash of JP¥544.4b as well as receivables valued at JP¥160.3b due within 12 months. So it actually has JP¥463.3b more liquid assets than total liabilities.
This surplus suggests that HOYA has a conservative balance sheet, and could probably eliminate its debt without much difficulty. Simply put, the fact that HOYA has more cash than debt is arguably a good indication that it can manage its debt safely.
While HOYA doesn't seem to have gained much on the EBIT line, at least earnings remain stable for now. The balance sheet is clearly the area to focus on when you are analysing debt. But ultimately the future profitability of the business will decide if HOYA can strengthen its balance sheet over time. So if you're focused on the future you can check out this free report showing analyst profit forecasts.
But our final consideration is also important, because a company cannot pay debt with paper profits; it needs cold hard cash. HOYA may have net cash on the balance sheet, but it is still interesting to look at how well the business converts its earnings before interest and tax (EBIT) to free cash flow, because that will influence both its need for, and its capacity to manage debt. During the last three years, HOYA generated free cash flow amounting to a very robust 82% of its EBIT, more than we'd expect. That positions it well to pay down debt if desirable to do so.
Summing Up
While it is always sensible to investigate a company's debt, in this case HOYA has JP¥541.9b in net cash and a decent-looking balance sheet. The cherry on top was that in converted 82% of that EBIT to free cash flow, bringing in JP¥182b. So is HOYA's debt a risk? It doesn't seem so to us. Above most other metrics, we think its important to track how fast earnings per share is growing, if at all. If you've also come to that realization, you're in luck, because today you can view this interactive graph of HOYA's earnings per share history for free.
If, after all that, you're more interested in a fast growing company with a rock-solid balance sheet, then check out our list of net cash growth stocks without delay.
Valuation is complex, but we're here to simplify it.
Discover if HOYA might be undervalued or overvalued with our detailed analysis, featuring fair value estimates, potential risks, dividends, insider trades, and its financial condition.
Access Free AnalysisHave feedback on this article? Concerned about the content? Get in touch with us directly. Alternatively, email editorial-team (at) simplywallst.com.
This article by Simply Wall St is general in nature. We provide commentary based on historical data and analyst forecasts only using an unbiased methodology and our articles are not intended to be financial advice. It does not constitute a recommendation to buy or sell any stock, and does not take account of your objectives, or your financial situation. We aim to bring you long-term focused analysis driven by fundamental data. Note that our analysis may not factor in the latest price-sensitive company announcements or qualitative material. Simply Wall St has no position in any stocks mentioned.
Have feedback on this article? Concerned about the content? Get in touch with us directly. Alternatively, email editorial-team@simplywallst.com
About TSE:7741
HOYA
A med-tech company, provides high-tech and medical products worldwide.
Outstanding track record with excellent balance sheet.
Market Insights


Advertisement
Community Narratives
Nike's Direct-to-Consumer Focus Will Drive Future Growth
Fair Value US$87.90|22.7% undervalued
UN
Community Contributor
Novo Nordisk will dominate GLP-1 market with Ozempic and Wegovy growth
Fair Value US$89.59|14.2% undervalued
BE
Community Contributor
Rheinmetall could get 20-25% of EU-NATO 3%-GDP defence spending
Fair Value €7.57k|82.8% undervalued
NO
Community Contributor