
Advertisement
- Japan
- /
- Medical Equipment
- /
- TSE:6869
These 4 Measures Indicate That Sysmex (TSE:6869) Is Using Debt Reasonably Well
The external fund manager backed by Berkshire Hathaway's Charlie Munger, Li Lu, makes no bones about it when he says 'The biggest investment risk is not the volatility of prices, but whether you will suffer a permanent loss of capital.' It's only natural to consider a company's balance sheet when you examine how risky it is, since debt is often involved when a business collapses. Importantly, Sysmex Corporation (TSE:6869) does carry debt. But is this debt a concern to shareholders?
When Is Debt A Problem?
Debt assists a business until the business has trouble paying it off, either with new capital or with free cash flow. Part and parcel of capitalism is the process of 'creative destruction' where failed businesses are mercilessly liquidated by their bankers. While that is not too common, we often do see indebted companies permanently diluting shareholders because lenders force them to raise capital at a distressed price. Having said that, the most common situation is where a company manages its debt reasonably well - and to its own advantage. When we examine debt levels, we first consider both cash and debt levels, together.
See our latest analysis for Sysmex
What Is Sysmex's Net Debt?
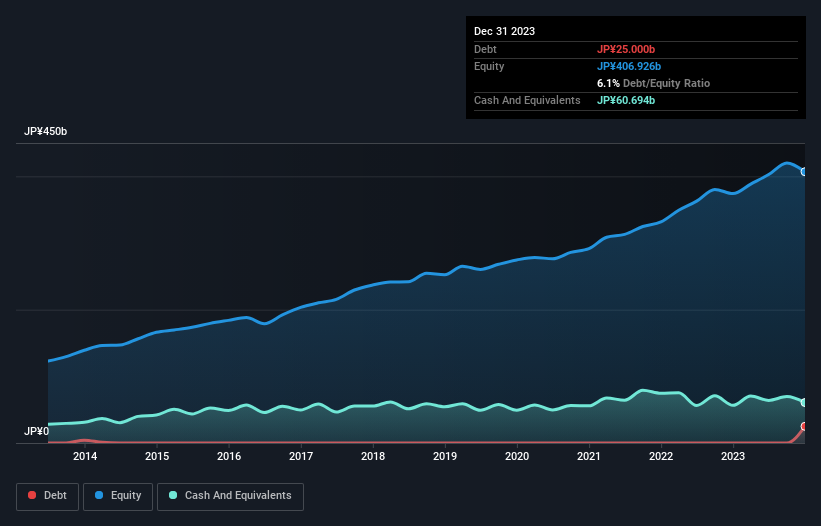
As you can see below, at the end of December 2023, Sysmex had JP¥25.0b of debt, up from none a year ago. Click the image for more detail. But it also has JP¥60.7b in cash to offset that, meaning it has JP¥35.7b net cash.
A Look At Sysmex's Liabilities
The latest balance sheet data shows that Sysmex had liabilities of JP¥98.5b due within a year, and liabilities of JP¥61.8b falling due after that. Offsetting these obligations, it had cash of JP¥60.7b as well as receivables valued at JP¥133.5b due within 12 months. So it can boast JP¥33.9b more liquid assets than total liabilities.
This surplus suggests that Sysmex has a conservative balance sheet, and could probably eliminate its debt without much difficulty. Simply put, the fact that Sysmex has more cash than debt is arguably a good indication that it can manage its debt safely.
Fortunately, Sysmex grew its EBIT by 2.4% in the last year, making that debt load look even more manageable. There's no doubt that we learn most about debt from the balance sheet. But ultimately the future profitability of the business will decide if Sysmex can strengthen its balance sheet over time. So if you want to see what the professionals think, you might find this free report on analyst profit forecasts to be interesting.
Finally, a business needs free cash flow to pay off debt; accounting profits just don't cut it. While Sysmex has net cash on its balance sheet, it's still worth taking a look at its ability to convert earnings before interest and tax (EBIT) to free cash flow, to help us understand how quickly it is building (or eroding) that cash balance. In the last three years, Sysmex's free cash flow amounted to 31% of its EBIT, less than we'd expect. That's not great, when it comes to paying down debt.
Summing Up
While it is always sensible to investigate a company's debt, in this case Sysmex has JP¥35.7b in net cash and a decent-looking balance sheet. On top of that, it increased its EBIT by 2.4% in the last twelve months. So we don't have any problem with Sysmex's use of debt. Over time, share prices tend to follow earnings per share, so if you're interested in Sysmex, you may well want to click here to check an interactive graph of its earnings per share history.
If you're interested in investing in businesses that can grow profits without the burden of debt, then check out this free list of growing businesses that have net cash on the balance sheet.
New: Manage All Your Stock Portfolios in One Place
We've created the ultimate portfolio companion for stock investors, and it's free.
• Connect an unlimited number of Portfolios and see your total in one currency
• Be alerted to new Warning Signs or Risks via email or mobile
• Track the Fair Value of your stocks
Have feedback on this article? Concerned about the content? Get in touch with us directly. Alternatively, email editorial-team (at) simplywallst.com.
This article by Simply Wall St is general in nature. We provide commentary based on historical data and analyst forecasts only using an unbiased methodology and our articles are not intended to be financial advice. It does not constitute a recommendation to buy or sell any stock, and does not take account of your objectives, or your financial situation. We aim to bring you long-term focused analysis driven by fundamental data. Note that our analysis may not factor in the latest price-sensitive company announcements or qualitative material. Simply Wall St has no position in any stocks mentioned.
About TSE:6869
Sysmex
Engages in the development, manufacture, and sale of diagnostic instruments, reagents, and related software.
Excellent balance sheet established dividend payer.
Similar Companies
Market Insights

Advertisement
Community Narratives
Quality at a Premium. A time to watch, not to buy?
Fair Value US$154.56|29.3% undervalued
DA
Community Contributor
GRAB: The Super-App at the Heart of Southeast Asia’s Digital Boom
Fair Value US$6.60|7.0% undervalued
BL
Community Contributor
Verve Group to Surge with 51.61% Revenue Growth
Fair Value €6.00|65.0% undervalued
ME
Community Contributor