

MedPeer,Inc.'s (TSE:6095) earnings announcement last week didn't impress shareholders. Despite the soft profit numbers, our analysis has optimistic about the overall quality of the income statement.
View our latest analysis for MedPeerInc
A Closer Look At MedPeerInc's Earnings
Many investors haven't heard of the accrual ratio from cashflow, but it is actually a useful measure of how well a company's profit is backed up by free cash flow (FCF) during a given period. The accrual ratio subtracts the FCF from the profit for a given period, and divides the result by the average operating assets of the company over that time. You could think of the accrual ratio from cashflow as the 'non-FCF profit ratio'.
Therefore, it's actually considered a good thing when a company has a negative accrual ratio, but a bad thing if its accrual ratio is positive. While it's not a problem to have a positive accrual ratio, indicating a certain level of non-cash profits, a high accrual ratio is arguably a bad thing, because it indicates paper profits are not matched by cash flow. To quote a 2014 paper by Lewellen and Resutek, "firms with higher accruals tend to be less profitable in the future".
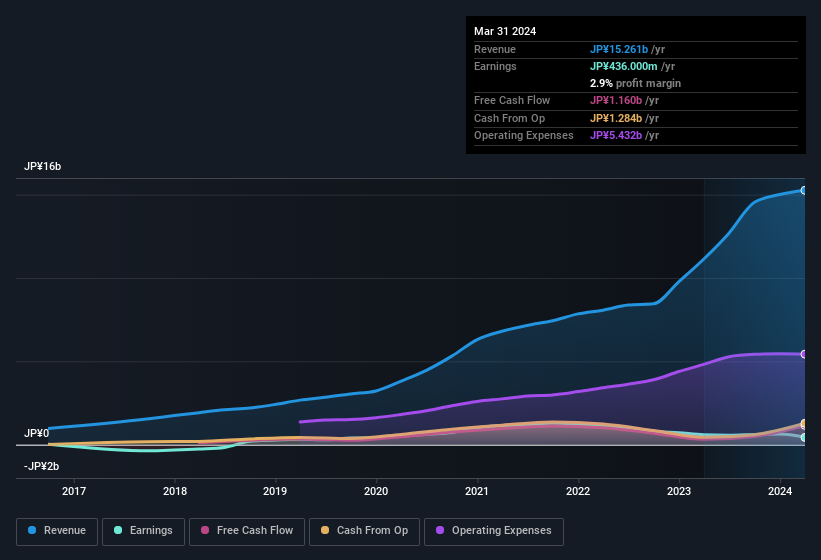
For the year to March 2024, MedPeerInc had an accrual ratio of -0.11. That indicates that its free cash flow was a fair bit more than its statutory profit. Indeed, in the last twelve months it reported free cash flow of JP¥1.2b, well over the JP¥436.0m it reported in profit. MedPeerInc's free cash flow improved over the last year, which is generally good to see. Having said that, there is more to the story. We can see that unusual items have impacted its statutory profit, and therefore the accrual ratio.
That might leave you wondering what analysts are forecasting in terms of future profitability. Luckily, you can click here to see an interactive graph depicting future profitability, based on their estimates.
The Impact Of Unusual Items On Profit
MedPeerInc's profit was reduced by unusual items worth JP¥408m in the last twelve months, and this helped it produce high cash conversion, as reflected by its unusual items. In a scenario where those unusual items included non-cash charges, we'd expect to see a strong accrual ratio, which is exactly what has happened in this case. While deductions due to unusual items are disappointing in the first instance, there is a silver lining. When we analysed the vast majority of listed companies worldwide, we found that significant unusual items are often not repeated. And that's hardly a surprise given these line items are considered unusual. If MedPeerInc doesn't see those unusual expenses repeat, then all else being equal we'd expect its profit to increase over the coming year.
Our Take On MedPeerInc's Profit Performance
In conclusion, both MedPeerInc's accrual ratio and its unusual items suggest that its statutory earnings are probably reasonably conservative. Looking at all these factors, we'd say that MedPeerInc's underlying earnings power is at least as good as the statutory numbers would make it seem. If you want to do dive deeper into MedPeerInc, you'd also look into what risks it is currently facing. For example, we've discovered 3 warning signs that you should run your eye over to get a better picture of MedPeerInc.
After our examination into the nature of MedPeerInc's profit, we've come away optimistic for the company. But there is always more to discover if you are capable of focussing your mind on minutiae. Some people consider a high return on equity to be a good sign of a quality business. While it might take a little research on your behalf, you may find this free collection of companies boasting high return on equity, or this list of stocks with significant insider holdings to be useful.
If you're looking to trade MedPeerInc, open an account with the lowest-cost platform trusted by professionals, Interactive Brokers.
With clients in over 200 countries and territories, and access to 160 markets, IBKR lets you trade stocks, options, futures, forex, bonds and funds from a single integrated account.
Enjoy no hidden fees, no account minimums, and FX conversion rates as low as 0.03%, far better than what most brokers offer.
Sponsored ContentNew: Manage All Your Stock Portfolios in One Place
We've created the ultimate portfolio companion for stock investors, and it's free.
• Connect an unlimited number of Portfolios and see your total in one currency
• Be alerted to new Warning Signs or Risks via email or mobile
• Track the Fair Value of your stocks
Have feedback on this article? Concerned about the content? Get in touch with us directly. Alternatively, email editorial-team (at) simplywallst.com.
This article by Simply Wall St is general in nature. We provide commentary based on historical data and analyst forecasts only using an unbiased methodology and our articles are not intended to be financial advice. It does not constitute a recommendation to buy or sell any stock, and does not take account of your objectives, or your financial situation. We aim to bring you long-term focused analysis driven by fundamental data. Note that our analysis may not factor in the latest price-sensitive company announcements or qualitative material. Simply Wall St has no position in any stocks mentioned.
About TSE:6095
Excellent balance sheet and good value.

