- Japan
- /
- Healthcare Services
- /
- TSE:6029
Market Cool On Artra Group Corporation's (TSE:6029) Revenues Pushing Shares 34% Lower


The Artra Group Corporation (TSE:6029) share price has fared very poorly over the last month, falling by a substantial 34%. Instead of being rewarded, shareholders who have already held through the last twelve months are now sitting on a 40% share price drop.
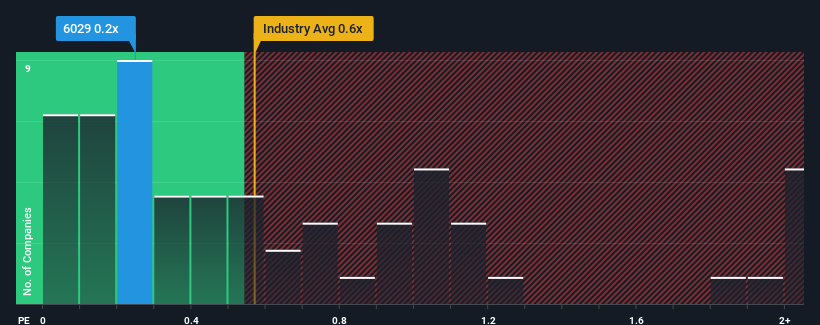
In spite of the heavy fall in price, you could still be forgiven for feeling indifferent about Artra Group's P/S ratio of 0.2x, since the median price-to-sales (or "P/S") ratio for the Healthcare industry in Japan is also close to 0.6x. Although, it's not wise to simply ignore the P/S without explanation as investors may be disregarding a distinct opportunity or a costly mistake.
See our latest analysis for Artra Group
How Has Artra Group Performed Recently?
As an illustration, revenue has deteriorated at Artra Group over the last year, which is not ideal at all. One possibility is that the P/S is moderate because investors think the company might still do enough to be in line with the broader industry in the near future. If not, then existing shareholders may be a little nervous about the viability of the share price.
Want the full picture on earnings, revenue and cash flow for the company? Then our free report on Artra Group will help you shine a light on its historical performance.How Is Artra Group's Revenue Growth Trending?
The only time you'd be comfortable seeing a P/S like Artra Group's is when the company's growth is tracking the industry closely.
Retrospectively, the last year delivered a frustrating 1.8% decrease to the company's top line. Still, the latest three year period has seen an excellent 85% overall rise in revenue, in spite of its unsatisfying short-term performance. So we can start by confirming that the company has generally done a very good job of growing revenue over that time, even though it had some hiccups along the way.
Comparing that to the industry, which is only predicted to deliver 6.8% growth in the next 12 months, the company's momentum is stronger based on recent medium-term annualised revenue results.
With this information, we find it interesting that Artra Group is trading at a fairly similar P/S compared to the industry. It may be that most investors are not convinced the company can maintain its recent growth rates.
What We Can Learn From Artra Group's P/S?
Following Artra Group's share price tumble, its P/S is just clinging on to the industry median P/S. It's argued the price-to-sales ratio is an inferior measure of value within certain industries, but it can be a powerful business sentiment indicator.
To our surprise, Artra Group revealed its three-year revenue trends aren't contributing to its P/S as much as we would have predicted, given they look better than current industry expectations. It'd be fair to assume that potential risks the company faces could be the contributing factor to the lower than expected P/S. It appears some are indeed anticipating revenue instability, because the persistence of these recent medium-term conditions would normally provide a boost to the share price.
Before you take the next step, you should know about the 3 warning signs for Artra Group (2 are significant!) that we have uncovered.
Of course, profitable companies with a history of great earnings growth are generally safer bets. So you may wish to see this free collection of other companies that have reasonable P/E ratios and have grown earnings strongly.
If you're looking to trade Artra Group, open an account with the lowest-cost platform trusted by professionals, Interactive Brokers.
With clients in over 200 countries and territories, and access to 160 markets, IBKR lets you trade stocks, options, futures, forex, bonds and funds from a single integrated account.
Enjoy no hidden fees, no account minimums, and FX conversion rates as low as 0.03%, far better than what most brokers offer.
Sponsored ContentNew: Manage All Your Stock Portfolios in One Place
We've created the ultimate portfolio companion for stock investors, and it's free.
• Connect an unlimited number of Portfolios and see your total in one currency
• Be alerted to new Warning Signs or Risks via email or mobile
• Track the Fair Value of your stocks
Have feedback on this article? Concerned about the content? Get in touch with us directly. Alternatively, email editorial-team (at) simplywallst.com.
This article by Simply Wall St is general in nature. We provide commentary based on historical data and analyst forecasts only using an unbiased methodology and our articles are not intended to be financial advice. It does not constitute a recommendation to buy or sell any stock, and does not take account of your objectives, or your financial situation. We aim to bring you long-term focused analysis driven by fundamental data. Note that our analysis may not factor in the latest price-sensitive company announcements or qualitative material. Simply Wall St has no position in any stocks mentioned.
Have feedback on this article? Concerned about the content? Get in touch with us directly. Alternatively, email editorial-team@simplywallst.com
About TSE:6029
Artra Group
Provides support services for acupuncture, moxibustion, and orthopedic clinics in Japan.
Excellent balance sheet and slightly overvalued.
Market Insights

Community Narratives

