Advertisement
- Japan
- /
- Healthcare Services
- /
- TSE:4544
Assessing H.U. Group Holdings (TSE:4544) Valuation After Upgraded Profit Forecast and Asset Sale Gains

Simply Wall St
Reviewed by Kshitija Bhandaru
H.U. Group Holdings (TSE:4544) recently raised its profit forecast for fiscal year 2026, citing stronger-than-expected gains from selling non-current assets and stakes in subsidiaries. This upward revision could shift investor expectations around future profitability.
See our latest analysis for H.U. Group Holdings.
The boost in H.U. Group Holdings’ profit forecast seems to have landed well with the market, helping build momentum after a series of updates last quarter. The 44% share price return year-to-date and 41% total shareholder return for the past year suggest renewed confidence, especially as investors digest guidance upgrades and plans to introduce a stock grant scheme.
If these moves have you rethinking your own approach, this is the perfect chance to broaden your search and explore fast growing stocks with high insider ownership.
With shares already up over 40% this year and guidance now reflecting fresh profit tailwinds, the question arises: is H.U. Group Holdings undervalued at current levels, or has the market fully priced in this growth?
Price-to-Sales of 0.9x: Is it justified?
H.U. Group Holdings trades at a price-to-sales (P/S) ratio of 0.9x, which is higher than both the peer average (0.7x) and the broader JP Healthcare industry average (0.6x). Despite recent share price gains, the market appears to be valuing the company’s sales at a premium to sector norms.
The price-to-sales ratio compares a company's market capitalization to its total revenue, providing a sense of how much investors are willing to pay for every yen of sales. For healthcare companies, this multiple can help adjust for periods with unusually high or volatile earnings and can capture top-line growth potential.
For H.U. Group Holdings, the elevated P/S suggests investors anticipate stronger revenue generation or future growth relative to peers. However, it may also indicate heightened optimism or premium pricing that could correct if performance softens. Compared to the estimated fair P/S ratio of 0.9x, H.U. Group's current multiple appears in line with fundamental value, but it clearly exceeds the average seen in both close peers and the industry as a whole. If the market reevaluates what is considered fair, there is room for this multiple to converge toward sector standards.
Explore the SWS fair ratio for H.U. Group Holdings
Result: Price-to-Sales of 0.9x (ABOUT RIGHT)
However, a pullback could emerge if sector optimism fades or if H.U. Group Holdings' robust profit growth slows in upcoming quarters.
Find out about the key risks to this H.U. Group Holdings narrative.
Another View: Discounted Cash Flow Model
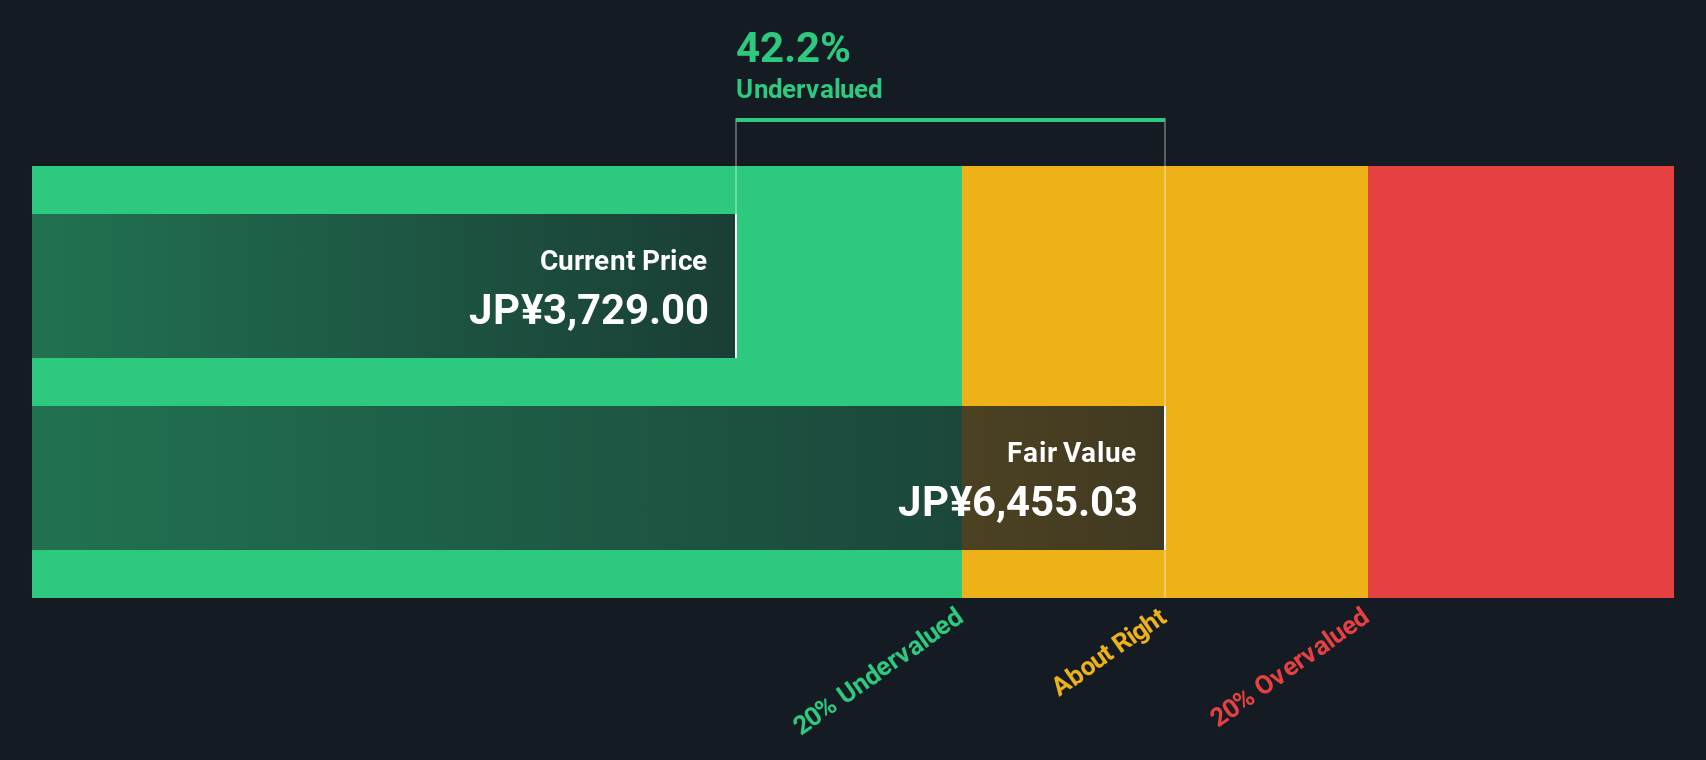
Looking at H.U. Group Holdings through the lens of our DCF model, the result presents a much more bullish story. The SWS DCF model suggests shares are trading at a steep discount to intrinsic value, with the current market price about 43% below what the model estimates as fair. This stark difference compared to the current premium on the price-to-sales ratio raises an important question: is the market overlooking potential upside, or is the DCF too optimistic given current earnings quality?
Look into how the SWS DCF model arrives at its fair value.
Simply Wall St performs a discounted cash flow (DCF) on every stock in the world every day (check out H.U. Group Holdings for example). We show the entire calculation in full. You can track the result in your watchlist or portfolio and be alerted when this changes, or use our stock screener to discover undervalued stocks based on their cash flows. If you save a screener we even alert you when new companies match - so you never miss a potential opportunity.
Build Your Own H.U. Group Holdings Narrative
If you have a different perspective on the data or want to dive deeper yourself, you can easily craft your own take in just a few minutes. Do it your way.
A great starting point for your H.U. Group Holdings research is our analysis highlighting 3 key rewards and 3 important warning signs that could impact your investment decision.
Looking for more investment ideas?
Smart investors always keep new opportunities on their radar. Don’t miss your chance to find fresh market movers. These ideas could make all the difference to your portfolio.
- Spot hidden value with these 897 undervalued stocks based on cash flows and take advantage of stocks trading below their intrinsic worth before the crowd catches on.
- Capitalize on technological innovation by starting with these 25 AI penny stocks, connecting you with companies at the forefront of artificial intelligence transformation.
- Unlock steady income streams by exploring these 19 dividend stocks with yields > 3% and see which firms deliver attractive yields above 3%.
This article by Simply Wall St is general in nature. We provide commentary based on historical data and analyst forecasts only using an unbiased methodology and our articles are not intended to be financial advice. It does not constitute a recommendation to buy or sell any stock, and does not take account of your objectives, or your financial situation. We aim to bring you long-term focused analysis driven by fundamental data. Note that our analysis may not factor in the latest price-sensitive company announcements or qualitative material. Simply Wall St has no position in any stocks mentioned.
Valuation is complex, but we're here to simplify it.
Discover if H.U. Group Holdings might be undervalued or overvalued with our detailed analysis, featuring fair value estimates, potential risks, dividends, insider trades, and its financial condition.
Access Free AnalysisHave feedback on this article? Concerned about the content? Get in touch with us directly. Alternatively, email editorial-team@simplywallst.com
About TSE:4544
H.U. Group Holdings
Operates healthcare business in Japan, the United States, Europe, and internationally.
Flawless balance sheet and fair value.
Similar Companies
Market Insights

Advertisement
Community Narratives
Kodiak AI - a potential 100 bagger opportunity?
Fair Value US$14.00|41.9% undervalued
DA
Community Contributor
A Fair Price for a Great Business Facing Real Threats
Fair Value US$383.06|14.1% undervalued
IM
Community Contributor
AXON And Shopify Integration Will Unlock Global Mobile Advertising
Fair Value US$613.59|1.3% undervalued
AN
Based on Analyst Price Targets