

CE Holdings Co.,Ltd. (TSE:4320) shareholders that were waiting for something to happen have been dealt a blow with a 25% share price drop in the last month. Instead of being rewarded, shareholders who have already held through the last twelve months are now sitting on a 30% share price drop.
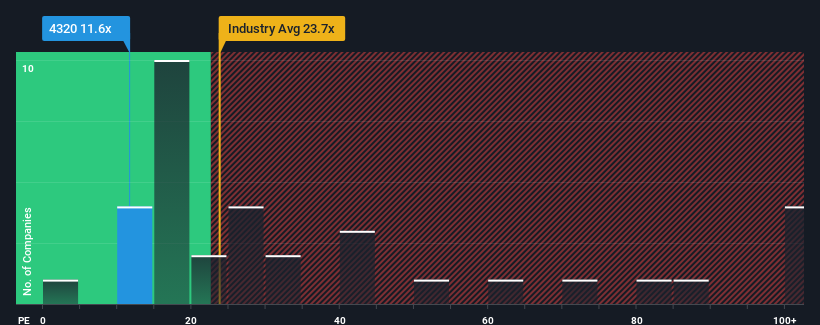
In spite of the heavy fall in price, you could still be forgiven for feeling indifferent about CE HoldingsLtd's P/E ratio of 11.6x, since the median price-to-earnings (or "P/E") ratio in Japan is also close to 13x. While this might not raise any eyebrows, if the P/E ratio is not justified investors could be missing out on a potential opportunity or ignoring looming disappointment.
For example, consider that CE HoldingsLtd's financial performance has been poor lately as its earnings have been in decline. One possibility is that the P/E is moderate because investors think the company might still do enough to be in line with the broader market in the near future. If you like the company, you'd at least be hoping this is the case so that you could potentially pick up some stock while it's not quite in favour.
See our latest analysis for CE HoldingsLtd
How Is CE HoldingsLtd's Growth Trending?
The only time you'd be comfortable seeing a P/E like CE HoldingsLtd's is when the company's growth is tracking the market closely.
If we review the last year of earnings, dishearteningly the company's profits fell to the tune of 24%. Still, the latest three year period has seen an excellent 70% overall rise in EPS, in spite of its unsatisfying short-term performance. So we can start by confirming that the company has generally done a very good job of growing earnings over that time, even though it had some hiccups along the way.
This is in contrast to the rest of the market, which is expected to grow by 10% over the next year, materially lower than the company's recent medium-term annualised growth rates.
With this information, we find it interesting that CE HoldingsLtd is trading at a fairly similar P/E to the market. Apparently some shareholders believe the recent performance is at its limits and have been accepting lower selling prices.
What We Can Learn From CE HoldingsLtd's P/E?
CE HoldingsLtd's plummeting stock price has brought its P/E right back to the rest of the market. We'd say the price-to-earnings ratio's power isn't primarily as a valuation instrument but rather to gauge current investor sentiment and future expectations.
Our examination of CE HoldingsLtd revealed its three-year earnings trends aren't contributing to its P/E as much as we would have predicted, given they look better than current market expectations. There could be some unobserved threats to earnings preventing the P/E ratio from matching this positive performance. At least the risk of a price drop looks to be subdued if recent medium-term earnings trends continue, but investors seem to think future earnings could see some volatility.
Plus, you should also learn about these 2 warning signs we've spotted with CE HoldingsLtd.
It's important to make sure you look for a great company, not just the first idea you come across. So take a peek at this free list of interesting companies with strong recent earnings growth (and a low P/E).
If you're looking to trade CE HoldingsLtd, open an account with the lowest-cost platform trusted by professionals, Interactive Brokers.
With clients in over 200 countries and territories, and access to 160 markets, IBKR lets you trade stocks, options, futures, forex, bonds and funds from a single integrated account.
Enjoy no hidden fees, no account minimums, and FX conversion rates as low as 0.03%, far better than what most brokers offer.
Sponsored ContentNew: AI Stock Screener & Alerts
Our new AI Stock Screener scans the market every day to uncover opportunities.
• Dividend Powerhouses (3%+ Yield)
• Undervalued Small Caps with Insider Buying
• High growth Tech and AI Companies
Or build your own from over 50 metrics.
Have feedback on this article? Concerned about the content? Get in touch with us directly. Alternatively, email editorial-team (at) simplywallst.com.
This article by Simply Wall St is general in nature. We provide commentary based on historical data and analyst forecasts only using an unbiased methodology and our articles are not intended to be financial advice. It does not constitute a recommendation to buy or sell any stock, and does not take account of your objectives, or your financial situation. We aim to bring you long-term focused analysis driven by fundamental data. Note that our analysis may not factor in the latest price-sensitive company announcements or qualitative material. Simply Wall St has no position in any stocks mentioned.
Have feedback on this article? Concerned about the content? Get in touch with us directly. Alternatively, email editorial-team@simplywallst.com
About TSE:4320
CE HoldingsLtd
Through its subsidiaries, develops and sells electronic medical record systems and medical information systems in Japan.
Excellent balance sheet slight.
Market Insights

Community Narratives

