
Advertisement

The external fund manager backed by Berkshire Hathaway's Charlie Munger, Li Lu, makes no bones about it when he says 'The biggest investment risk is not the volatility of prices, but whether you will suffer a permanent loss of capital.' When we think about how risky a company is, we always like to look at its use of debt, since debt overload can lead to ruin. Importantly, CE Holdings Co.,Ltd. (TSE:4320) does carry debt. But should shareholders be worried about its use of debt?
What Risk Does Debt Bring?
Debt assists a business until the business has trouble paying it off, either with new capital or with free cash flow. Ultimately, if the company can't fulfill its legal obligations to repay debt, shareholders could walk away with nothing. However, a more usual (but still expensive) situation is where a company must dilute shareholders at a cheap share price simply to get debt under control. By replacing dilution, though, debt can be an extremely good tool for businesses that need capital to invest in growth at high rates of return. When we think about a company's use of debt, we first look at cash and debt together.
What Is CE HoldingsLtd's Net Debt?
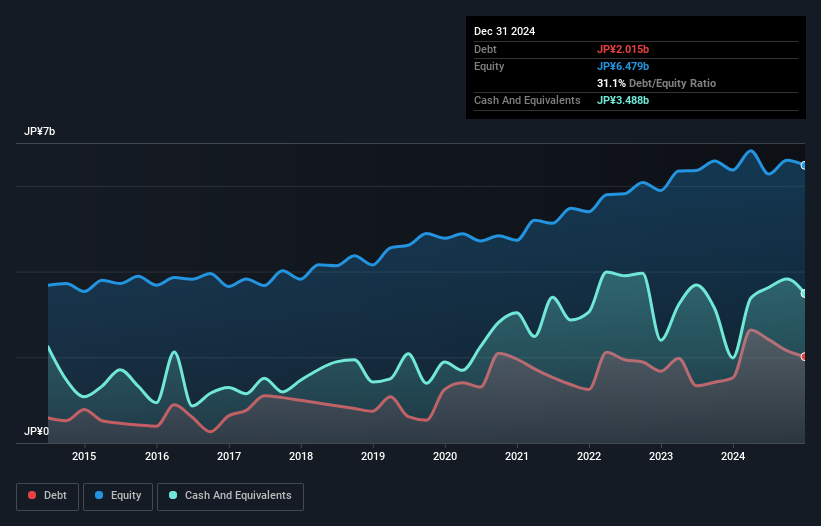
As you can see below, at the end of December 2024, CE HoldingsLtd had JP¥2.02b of debt, up from JP¥1.52b a year ago. Click the image for more detail. However, it does have JP¥3.49b in cash offsetting this, leading to net cash of JP¥1.47b.
A Look At CE HoldingsLtd's Liabilities
According to the last reported balance sheet, CE HoldingsLtd had liabilities of JP¥2.84b due within 12 months, and liabilities of JP¥1.71b due beyond 12 months. On the other hand, it had cash of JP¥3.49b and JP¥3.14b worth of receivables due within a year. So it actually has JP¥2.07b more liquid assets than total liabilities.
It's good to see that CE HoldingsLtd has plenty of liquidity on its balance sheet, suggesting conservative management of liabilities. Because it has plenty of assets, it is unlikely to have trouble with its lenders. Simply put, the fact that CE HoldingsLtd has more cash than debt is arguably a good indication that it can manage its debt safely.
View our latest analysis for CE HoldingsLtd
Fortunately, CE HoldingsLtd grew its EBIT by 6.4% in the last year, making that debt load look even more manageable. There's no doubt that we learn most about debt from the balance sheet. But you can't view debt in total isolation; since CE HoldingsLtd will need earnings to service that debt. So when considering debt, it's definitely worth looking at the earnings trend. Click here for an interactive snapshot .
Finally, a business needs free cash flow to pay off debt; accounting profits just don't cut it. CE HoldingsLtd may have net cash on the balance sheet, but it is still interesting to look at how well the business converts its earnings before interest and tax (EBIT) to free cash flow, because that will influence both its need for, and its capacity to manage debt. Over the last three years, CE HoldingsLtd recorded negative free cash flow, in total. Debt is usually more expensive, and almost always more risky in the hands of a company with negative free cash flow. Shareholders ought to hope for an improvement.
Summing Up
While we empathize with investors who find debt concerning, you should keep in mind that CE HoldingsLtd has net cash of JP¥1.47b, as well as more liquid assets than liabilities. On top of that, it increased its EBIT by 6.4% in the last twelve months. So we don't have any problem with CE HoldingsLtd's use of debt. There's no doubt that we learn most about debt from the balance sheet. But ultimately, every company can contain risks that exist outside of the balance sheet. For example, we've discovered 5 warning signs for CE HoldingsLtd (1 is a bit unpleasant!) that you should be aware of before investing here.
At the end of the day, it's often better to focus on companies that are free from net debt. You can access our special list of such companies (all with a track record of profit growth). It's free.
New: AI Stock Screener & Alerts
Our new AI Stock Screener scans the market every day to uncover opportunities.
• Dividend Powerhouses (3%+ Yield)
• Undervalued Small Caps with Insider Buying
• High growth Tech and AI Companies
Or build your own from over 50 metrics.
Have feedback on this article? Concerned about the content? Get in touch with us directly. Alternatively, email editorial-team (at) simplywallst.com.
This article by Simply Wall St is general in nature. We provide commentary based on historical data and analyst forecasts only using an unbiased methodology and our articles are not intended to be financial advice. It does not constitute a recommendation to buy or sell any stock, and does not take account of your objectives, or your financial situation. We aim to bring you long-term focused analysis driven by fundamental data. Note that our analysis may not factor in the latest price-sensitive company announcements or qualitative material. Simply Wall St has no position in any stocks mentioned.
About TSE:4320
CE HoldingsLtd
Through its subsidiaries, develops and sells electronic medical record systems and medical information systems in Japan.
Flawless balance sheet established dividend payer.
Market Insights

Advertisement
Community Narratives
MicroStrategy: Volatile Gamble or Golden Opportunity?
Fair Value US$663.00|31.9% undervalued
BL
Community Contributor
Emerging Markets and Debt Reduction Will Propel Bath & Body Works Forward
Fair Value US$40.73|22.1% undervalued
ZW
Community Contributor
An amazing opportunity to potentially get a 100 bagger
Fair Value US$10.00|36.0% overvalued
DA
Community Contributor