
Advertisement
Warren Buffett famously said, 'Volatility is far from synonymous with risk.' When we think about how risky a company is, we always like to look at its use of debt, since debt overload can lead to ruin. Importantly, J Frontier Co.,Ltd. (TSE:2934) does carry debt. But is this debt a concern to shareholders?
When Is Debt A Problem?
Debt assists a business until the business has trouble paying it off, either with new capital or with free cash flow. Part and parcel of capitalism is the process of 'creative destruction' where failed businesses are mercilessly liquidated by their bankers. While that is not too common, we often do see indebted companies permanently diluting shareholders because lenders force them to raise capital at a distressed price. Having said that, the most common situation is where a company manages its debt reasonably well - and to its own advantage. The first step when considering a company's debt levels is to consider its cash and debt together.
See our latest analysis for J FrontierLtd
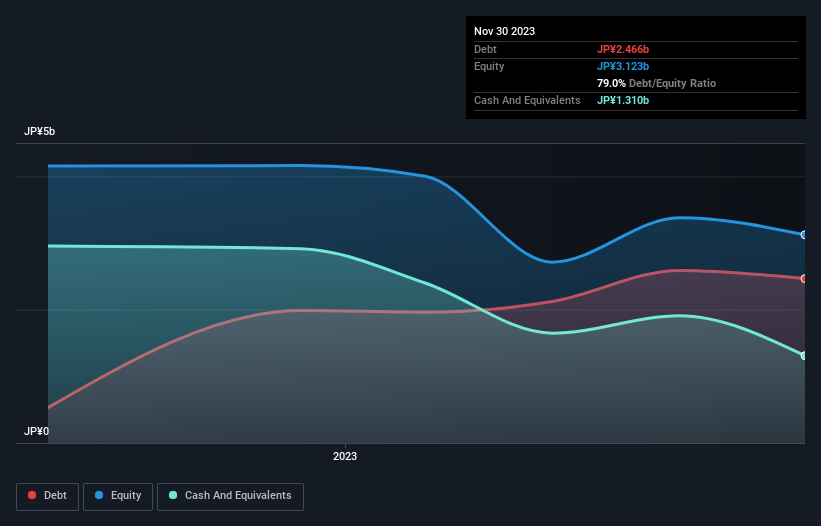
How Much Debt Does J FrontierLtd Carry?
As you can see below, at the end of November 2023, J FrontierLtd had JP¥2.47b of debt, up from JP¥1.99b a year ago. Click the image for more detail. On the flip side, it has JP¥1.31b in cash leading to net debt of about JP¥1.16b.
How Healthy Is J FrontierLtd's Balance Sheet?
Zooming in on the latest balance sheet data, we can see that J FrontierLtd had liabilities of JP¥2.55b due within 12 months and liabilities of JP¥1.69b due beyond that. Offsetting these obligations, it had cash of JP¥1.31b as well as receivables valued at JP¥1.55b due within 12 months. So it has liabilities totalling JP¥1.38b more than its cash and near-term receivables, combined.
Of course, J FrontierLtd has a market capitalization of JP¥16.7b, so these liabilities are probably manageable. However, we do think it is worth keeping an eye on its balance sheet strength, as it may change over time. When analysing debt levels, the balance sheet is the obvious place to start. But it is J FrontierLtd's earnings that will influence how the balance sheet holds up in the future. So if you're keen to discover more about its earnings, it might be worth checking out this graph of its long term earnings trend.
In the last year J FrontierLtd had a loss before interest and tax, and actually shrunk its revenue by 7.7%, to JP¥16b. We would much prefer see growth.
Caveat Emptor
Importantly, J FrontierLtd had an earnings before interest and tax (EBIT) loss over the last year. Its EBIT loss was a whopping JP¥1.7b. When we look at that and recall the liabilities on its balance sheet, relative to cash, it seems unwise to us for the company to have any debt. Quite frankly we think the balance sheet is far from match-fit, although it could be improved with time. Another cause for caution is that is bled JP¥2.3b in negative free cash flow over the last twelve months. So suffice it to say we consider the stock very risky. There's no doubt that we learn most about debt from the balance sheet. However, not all investment risk resides within the balance sheet - far from it. For example, we've discovered 5 warning signs for J FrontierLtd (2 shouldn't be ignored!) that you should be aware of before investing here.
Of course, if you're the type of investor who prefers buying stocks without the burden of debt, then don't hesitate to discover our exclusive list of net cash growth stocks, today.
New: Manage All Your Stock Portfolios in One Place
We've created the ultimate portfolio companion for stock investors, and it's free.
• Connect an unlimited number of Portfolios and see your total in one currency
• Be alerted to new Warning Signs or Risks via email or mobile
• Track the Fair Value of your stocks
Have feedback on this article? Concerned about the content? Get in touch with us directly. Alternatively, email editorial-team (at) simplywallst.com.
This article by Simply Wall St is general in nature. We provide commentary based on historical data and analyst forecasts only using an unbiased methodology and our articles are not intended to be financial advice. It does not constitute a recommendation to buy or sell any stock, and does not take account of your objectives, or your financial situation. We aim to bring you long-term focused analysis driven by fundamental data. Note that our analysis may not factor in the latest price-sensitive company announcements or qualitative material. Simply Wall St has no position in any stocks mentioned.
About TSE:2934
J FrontierLtd
Engages in the healthcare sale, medical care sale, and healthcare marketing businesses in Japan.
Acceptable track record with mediocre balance sheet.
Market Insights

Advertisement
Community Narratives
A formidable player in AI and enterprise computing.
Fair Value US$210.00|12.2% overvalued
CO
Community Contributor
IREN's Bold Moves in Sustainable Bitcoin Mining & AI Data Centers
Fair Value US$72.52|17.1% undervalued
BL
Community Contributor
Cooling the Champions: The Aussie Tech Behind F1's Victories
Fair Value AU$12.40|38.1% undervalued
TR
Community Contributor