- Japan
- /
- Healthcare Services
- /
- TSE:2435
CEDAR.Co.Ltd Full Year 2025 Earnings: EPS: JP¥30.92 (vs JP¥18.09 in FY 2024)


CEDAR.Co.Ltd (TSE:2435) Full Year 2025 Results
Key Financial Results
- Revenue: JP¥17.8b (up 3.0% from FY 2024).
- Net income: JP¥347.0m (up 71% from FY 2024).
- Profit margin: 1.9% (up from 1.2% in FY 2024). The increase in margin was driven by higher revenue.
- EPS: JP¥30.92 (up from JP¥18.09 in FY 2024).
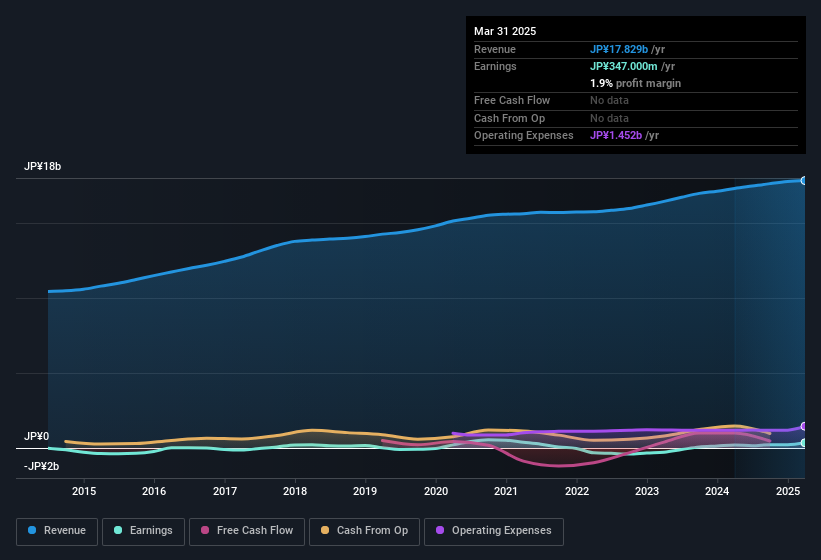
All figures shown in the chart above are for the trailing 12 month (TTM) period
CEDAR.Co.Ltd shares are down 6.0% from a week ago.
Risk Analysis
Before we wrap up, we've discovered 5 warning signs for CEDAR.Co.Ltd (2 are a bit unpleasant!) that you should be aware of.
New: AI Stock Screener & Alerts
Our new AI Stock Screener scans the market every day to uncover opportunities.
• Dividend Powerhouses (3%+ Yield)
• Undervalued Small Caps with Insider Buying
• High growth Tech and AI Companies
Or build your own from over 50 metrics.
Have feedback on this article? Concerned about the content? Get in touch with us directly. Alternatively, email editorial-team (at) simplywallst.com.
This article by Simply Wall St is general in nature. We provide commentary based on historical data and analyst forecasts only using an unbiased methodology and our articles are not intended to be financial advice. It does not constitute a recommendation to buy or sell any stock, and does not take account of your objectives, or your financial situation. We aim to bring you long-term focused analysis driven by fundamental data. Note that our analysis may not factor in the latest price-sensitive company announcements or qualitative material. Simply Wall St has no position in any stocks mentioned.
About TSE:2435
Moderate, good value and pays a dividend.
Market Insights

Community Narratives

