Estimating The Intrinsic Value Of House Foods Group Inc. (TSE:2810)


Key Insights
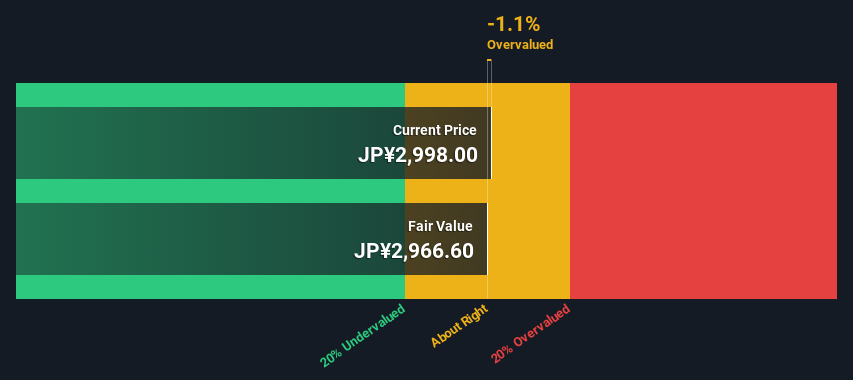
- The projected fair value for House Foods Group is JP¥2,967 based on 2 Stage Free Cash Flow to Equity
- With JP¥2,998 share price, House Foods Group appears to be trading close to its estimated fair value
- Our fair value estimate is 12% lower than House Foods Group's analyst price target of JP¥3,390
Today we will run through one way of estimating the intrinsic value of House Foods Group Inc. (TSE:2810) by taking the forecast future cash flows of the company and discounting them back to today's value. One way to achieve this is by employing the Discounted Cash Flow (DCF) model. Before you think you won't be able to understand it, just read on! It's actually much less complex than you'd imagine.
Remember though, that there are many ways to estimate a company's value, and a DCF is just one method. If you want to learn more about discounted cash flow, the rationale behind this calculation can be read in detail in the Simply Wall St analysis model.
Check out our latest analysis for House Foods Group
Crunching The Numbers
We are going to use a two-stage DCF model, which, as the name states, takes into account two stages of growth. The first stage is generally a higher growth period which levels off heading towards the terminal value, captured in the second 'steady growth' period. In the first stage we need to estimate the cash flows to the business over the next ten years. Where possible we use analyst estimates, but when these aren't available we extrapolate the previous free cash flow (FCF) from the last estimate or reported value. We assume companies with shrinking free cash flow will slow their rate of shrinkage, and that companies with growing free cash flow will see their growth rate slow, over this period. We do this to reflect that growth tends to slow more in the early years than it does in later years.
A DCF is all about the idea that a dollar in the future is less valuable than a dollar today, so we discount the value of these future cash flows to their estimated value in today's dollars:
10-year free cash flow (FCF) estimate
| 2025 | 2026 | 2027 | 2028 | 2029 | 2030 | 2031 | 2032 | 2033 | 2034 | |
| Levered FCF (¥, Millions) | JP¥3.96b | JP¥11.9b | JP¥13.3b | JP¥10.9b | JP¥12.2b | JP¥12.1b | JP¥12.0b | JP¥12.0b | JP¥12.0b | JP¥12.0b |
| Growth Rate Estimate Source | Analyst x1 | Analyst x2 | Analyst x2 | Analyst x1 | Analyst x1 | Est @ -0.79% | Est @ -0.48% | Est @ -0.25% | Est @ -0.10% | Est @ 0.01% |
| Present Value (¥, Millions) Discounted @ 4.2% | JP¥3.8k | JP¥10.9k | JP¥11.8k | JP¥9.3k | JP¥9.9k | JP¥9.4k | JP¥9.0k | JP¥8.6k | JP¥8.2k | JP¥7.9k |
("Est" = FCF growth rate estimated by Simply Wall St)
Present Value of 10-year Cash Flow (PVCF) = JP¥89b
After calculating the present value of future cash flows in the initial 10-year period, we need to calculate the Terminal Value, which accounts for all future cash flows beyond the first stage. For a number of reasons a very conservative growth rate is used that cannot exceed that of a country's GDP growth. In this case we have used the 5-year average of the 10-year government bond yield (0.3%) to estimate future growth. In the same way as with the 10-year 'growth' period, we discount future cash flows to today's value, using a cost of equity of 4.2%.
Terminal Value (TV)= FCF2034 × (1 + g) ÷ (r – g) = JP¥12b× (1 + 0.3%) ÷ (4.2%– 0.3%) = JP¥301b
Present Value of Terminal Value (PVTV)= TV / (1 + r)10= JP¥301b÷ ( 1 + 4.2%)10= JP¥199b
The total value, or equity value, is then the sum of the present value of the future cash flows, which in this case is JP¥287b. In the final step we divide the equity value by the number of shares outstanding. Relative to the current share price of JP¥3.0k, the company appears around fair value at the time of writing. The assumptions in any calculation have a big impact on the valuation, so it is better to view this as a rough estimate, not precise down to the last cent.
Important Assumptions
Now the most important inputs to a discounted cash flow are the discount rate, and of course, the actual cash flows. Part of investing is coming up with your own evaluation of a company's future performance, so try the calculation yourself and check your own assumptions. The DCF also does not consider the possible cyclicality of an industry, or a company's future capital requirements, so it does not give a full picture of a company's potential performance. Given that we are looking at House Foods Group as potential shareholders, the cost of equity is used as the discount rate, rather than the cost of capital (or weighted average cost of capital, WACC) which accounts for debt. In this calculation we've used 4.2%, which is based on a levered beta of 0.800. Beta is a measure of a stock's volatility, compared to the market as a whole. We get our beta from the industry average beta of globally comparable companies, with an imposed limit between 0.8 and 2.0, which is a reasonable range for a stable business.
SWOT Analysis for House Foods Group
- Debt is not viewed as a risk.
- Dividends are covered by earnings and cash flows.
- Earnings declined over the past year.
- Dividend is low compared to the top 25% of dividend payers in the Food market.
- Expensive based on P/E ratio and estimated fair value.
- Annual revenue is forecast to grow faster than the Japanese market.
- Annual earnings are forecast to grow slower than the Japanese market.
Next Steps:
Whilst important, the DCF calculation is only one of many factors that you need to assess for a company. DCF models are not the be-all and end-all of investment valuation. Instead the best use for a DCF model is to test certain assumptions and theories to see if they would lead to the company being undervalued or overvalued. For example, changes in the company's cost of equity or the risk free rate can significantly impact the valuation. For House Foods Group, there are three important aspects you should look at:
- Risks: For example, we've discovered 1 warning sign for House Foods Group that you should be aware of before investing here.
- Future Earnings: How does 2810's growth rate compare to its peers and the wider market? Dig deeper into the analyst consensus number for the upcoming years by interacting with our free analyst growth expectation chart.
- Other Solid Businesses: Low debt, high returns on equity and good past performance are fundamental to a strong business. Why not explore our interactive list of stocks with solid business fundamentals to see if there are other companies you may not have considered!
PS. The Simply Wall St app conducts a discounted cash flow valuation for every stock on the TSE every day. If you want to find the calculation for other stocks just search here.
Valuation is complex, but we're here to simplify it.
Discover if House Foods Group might be undervalued or overvalued with our detailed analysis, featuring fair value estimates, potential risks, dividends, insider trades, and its financial condition.
Access Free AnalysisHave feedback on this article? Concerned about the content? Get in touch with us directly. Alternatively, email editorial-team (at) simplywallst.com.
This article by Simply Wall St is general in nature. We provide commentary based on historical data and analyst forecasts only using an unbiased methodology and our articles are not intended to be financial advice. It does not constitute a recommendation to buy or sell any stock, and does not take account of your objectives, or your financial situation. We aim to bring you long-term focused analysis driven by fundamental data. Note that our analysis may not factor in the latest price-sensitive company announcements or qualitative material. Simply Wall St has no position in any stocks mentioned.
About TSE:2810
House Foods Group
Engages in the manufacture, sale, import, and export of spices, seasonings, and processed foods in Japan and internationally.
Excellent balance sheet average dividend payer.
Market Insights

Community Narratives

