

The external fund manager backed by Berkshire Hathaway's Charlie Munger, Li Lu, makes no bones about it when he says 'The biggest investment risk is not the volatility of prices, but whether you will suffer a permanent loss of capital.' So it might be obvious that you need to consider debt, when you think about how risky any given stock is, because too much debt can sink a company. We can see that Kikkoman Corporation (TSE:2801) does use debt in its business. But the real question is whether this debt is making the company risky.
When Is Debt A Problem?
Debt assists a business until the business has trouble paying it off, either with new capital or with free cash flow. Part and parcel of capitalism is the process of 'creative destruction' where failed businesses are mercilessly liquidated by their bankers. However, a more frequent (but still costly) occurrence is where a company must issue shares at bargain-basement prices, permanently diluting shareholders, just to shore up its balance sheet. Of course, debt can be an important tool in businesses, particularly capital heavy businesses. When we think about a company's use of debt, we first look at cash and debt together.
View our latest analysis for Kikkoman
What Is Kikkoman's Debt?
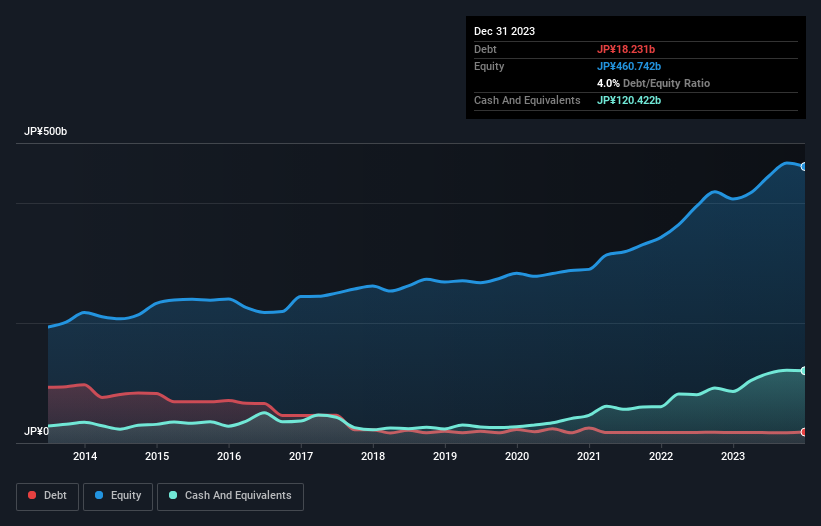
As you can see below, at the end of December 2023, Kikkoman had JP¥18.2b of debt, up from JP¥17.4b a year ago. Click the image for more detail. But on the other hand it also has JP¥120.4b in cash, leading to a JP¥102.2b net cash position.
A Look At Kikkoman's Liabilities
Zooming in on the latest balance sheet data, we can see that Kikkoman had liabilities of JP¥87.7b due within 12 months and liabilities of JP¥68.1b due beyond that. Offsetting this, it had JP¥120.4b in cash and JP¥86.1b in receivables that were due within 12 months. So it can boast JP¥50.7b more liquid assets than total liabilities.
This short term liquidity is a sign that Kikkoman could probably pay off its debt with ease, as its balance sheet is far from stretched. Simply put, the fact that Kikkoman has more cash than debt is arguably a good indication that it can manage its debt safely.
Another good sign is that Kikkoman has been able to increase its EBIT by 22% in twelve months, making it easier to pay down debt. There's no doubt that we learn most about debt from the balance sheet. But it is future earnings, more than anything, that will determine Kikkoman's ability to maintain a healthy balance sheet going forward. So if you want to see what the professionals think, you might find this free report on analyst profit forecasts to be interesting.
Finally, a company can only pay off debt with cold hard cash, not accounting profits. Kikkoman may have net cash on the balance sheet, but it is still interesting to look at how well the business converts its earnings before interest and tax (EBIT) to free cash flow, because that will influence both its need for, and its capacity to manage debt. During the last three years, Kikkoman produced sturdy free cash flow equating to 67% of its EBIT, about what we'd expect. This cold hard cash means it can reduce its debt when it wants to.
Summing Up
While we empathize with investors who find debt concerning, you should keep in mind that Kikkoman has net cash of JP¥102.2b, as well as more liquid assets than liabilities. And we liked the look of last year's 22% year-on-year EBIT growth. So is Kikkoman's debt a risk? It doesn't seem so to us. Over time, share prices tend to follow earnings per share, so if you're interested in Kikkoman, you may well want to click here to check an interactive graph of its earnings per share history.
Of course, if you're the type of investor who prefers buying stocks without the burden of debt, then don't hesitate to discover our exclusive list of net cash growth stocks, today.
Valuation is complex, but we're here to simplify it.
Discover if Kikkoman might be undervalued or overvalued with our detailed analysis, featuring fair value estimates, potential risks, dividends, insider trades, and its financial condition.
Access Free AnalysisHave feedback on this article? Concerned about the content? Get in touch with us directly. Alternatively, email editorial-team (at) simplywallst.com.
This article by Simply Wall St is general in nature. We provide commentary based on historical data and analyst forecasts only using an unbiased methodology and our articles are not intended to be financial advice. It does not constitute a recommendation to buy or sell any stock, and does not take account of your objectives, or your financial situation. We aim to bring you long-term focused analysis driven by fundamental data. Note that our analysis may not factor in the latest price-sensitive company announcements or qualitative material. Simply Wall St has no position in any stocks mentioned.
About TSE:2801
Kikkoman
Through its subsidiaries, manufactures and sells food products in Japan and internationally.
Flawless balance sheet with solid track record and pays a dividend.
