
Advertisement
These 4 Measures Indicate That Ito En (TSE:2593) Is Using Debt Reasonably Well
Some say volatility, rather than debt, is the best way to think about risk as an investor, but Warren Buffett famously said that 'Volatility is far from synonymous with risk.' So it seems the smart money knows that debt - which is usually involved in bankruptcies - is a very important factor, when you assess how risky a company is. Importantly, Ito En, Ltd. (TSE:2593) does carry debt. But should shareholders be worried about its use of debt?
Why Does Debt Bring Risk?
Debt is a tool to help businesses grow, but if a business is incapable of paying off its lenders, then it exists at their mercy. In the worst case scenario, a company can go bankrupt if it cannot pay its creditors. However, a more common (but still painful) scenario is that it has to raise new equity capital at a low price, thus permanently diluting shareholders. Having said that, the most common situation is where a company manages its debt reasonably well - and to its own advantage. The first thing to do when considering how much debt a business uses is to look at its cash and debt together.
Check out our latest analysis for Ito En
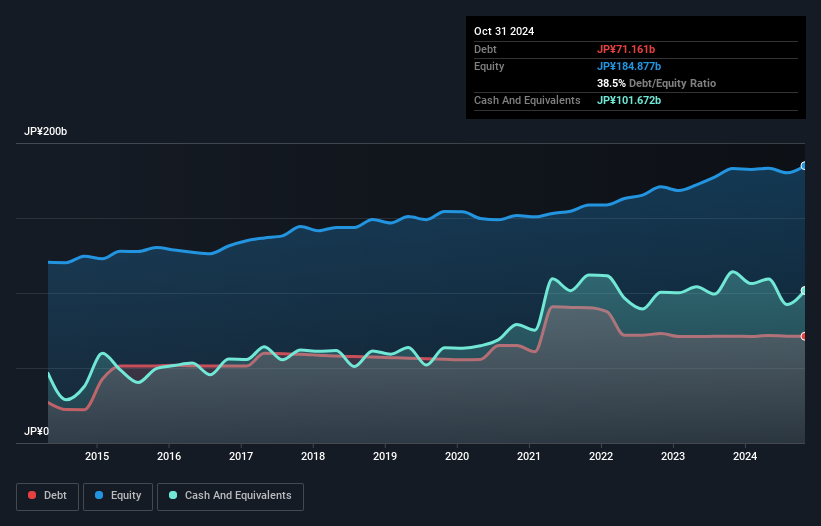
What Is Ito En's Net Debt?
As you can see below, Ito En had JP¥71.2b of debt, at October 2024, which is about the same as the year before. You can click the chart for greater detail. But it also has JP¥101.7b in cash to offset that, meaning it has JP¥30.5b net cash.
How Healthy Is Ito En's Balance Sheet?
The latest balance sheet data shows that Ito En had liabilities of JP¥112.9b due within a year, and liabilities of JP¥57.6b falling due after that. On the other hand, it had cash of JP¥101.7b and JP¥68.8b worth of receivables due within a year. So its total liabilities are just about perfectly matched by its shorter-term, liquid assets.
Having regard to Ito En's size, it seems that its liquid assets are well balanced with its total liabilities. So while it's hard to imagine that the JP¥335.9b company is struggling for cash, we still think it's worth monitoring its balance sheet. Simply put, the fact that Ito En has more cash than debt is arguably a good indication that it can manage its debt safely.
But the bad news is that Ito En has seen its EBIT plunge 12% in the last twelve months. If that rate of decline in earnings continues, the company could find itself in a tight spot. The balance sheet is clearly the area to focus on when you are analysing debt. But ultimately the future profitability of the business will decide if Ito En can strengthen its balance sheet over time. So if you're focused on the future you can check out this free report showing analyst profit forecasts.
Finally, a company can only pay off debt with cold hard cash, not accounting profits. While Ito En has net cash on its balance sheet, it's still worth taking a look at its ability to convert earnings before interest and tax (EBIT) to free cash flow, to help us understand how quickly it is building (or eroding) that cash balance. Over the most recent three years, Ito En recorded free cash flow worth 60% of its EBIT, which is around normal, given free cash flow excludes interest and tax. This free cash flow puts the company in a good position to pay down debt, when appropriate.
Summing Up
While it is always sensible to investigate a company's debt, in this case Ito En has JP¥30.5b in net cash and a decent-looking balance sheet. So we don't have any problem with Ito En's use of debt. Over time, share prices tend to follow earnings per share, so if you're interested in Ito En, you may well want to click here to check an interactive graph of its earnings per share history.
When all is said and done, sometimes its easier to focus on companies that don't even need debt. Readers can access a list of growth stocks with zero net debt 100% free, right now.
New: AI Stock Screener & Alerts
Our new AI Stock Screener scans the market every day to uncover opportunities.
• Dividend Powerhouses (3%+ Yield)
• Undervalued Small Caps with Insider Buying
• High growth Tech and AI Companies
Or build your own from over 50 metrics.
Have feedback on this article? Concerned about the content? Get in touch with us directly. Alternatively, email editorial-team (at) simplywallst.com.
This article by Simply Wall St is general in nature. We provide commentary based on historical data and analyst forecasts only using an unbiased methodology and our articles are not intended to be financial advice. It does not constitute a recommendation to buy or sell any stock, and does not take account of your objectives, or your financial situation. We aim to bring you long-term focused analysis driven by fundamental data. Note that our analysis may not factor in the latest price-sensitive company announcements or qualitative material. Simply Wall St has no position in any stocks mentioned.
About TSE:2593
Ito En
Manufactures and sells green tea beverages in Japan and internationally.
Flawless balance sheet with proven track record.
Market Insights

Advertisement
Community Narratives
Kodiak AI - a potential 100 bagger opportunity?
Fair Value US$14.00|44.7% undervalued
DA
Community Contributor
A Fair Price for a Great Business Facing Real Threats
Fair Value US$383.06|13.0% undervalued
IM
Community Contributor
AXON And Shopify Integration Will Unlock Global Mobile Advertising
Fair Value US$646.30|7.3% undervalued
AN
Based on Analyst Price Targets