
Advertisement
David Iben put it well when he said, 'Volatility is not a risk we care about. What we care about is avoiding the permanent loss of capital.' When we think about how risky a company is, we always like to look at its use of debt, since debt overload can lead to ruin. Importantly, Ito En, Ltd. (TSE:2593) does carry debt. But should shareholders be worried about its use of debt?
Why Does Debt Bring Risk?
Debt and other liabilities become risky for a business when it cannot easily fulfill those obligations, either with free cash flow or by raising capital at an attractive price. Part and parcel of capitalism is the process of 'creative destruction' where failed businesses are mercilessly liquidated by their bankers. However, a more common (but still painful) scenario is that it has to raise new equity capital at a low price, thus permanently diluting shareholders. Of course, plenty of companies use debt to fund growth, without any negative consequences. The first step when considering a company's debt levels is to consider its cash and debt together.
See our latest analysis for Ito En
How Much Debt Does Ito En Carry?
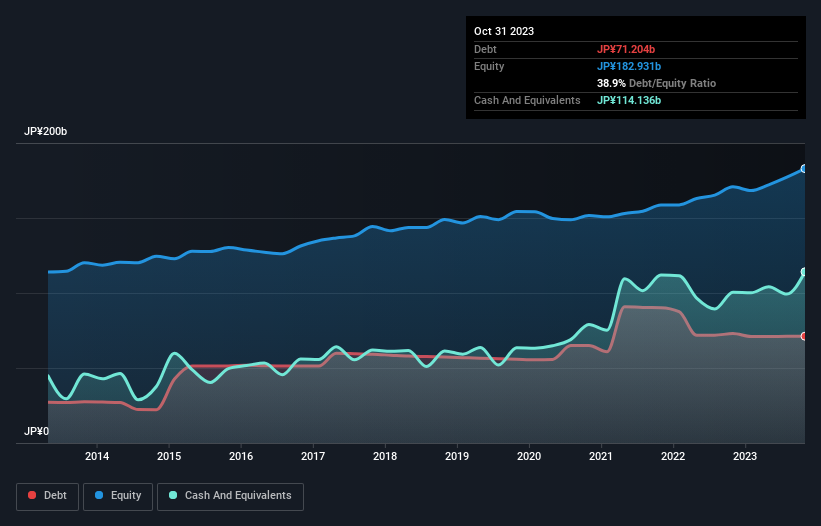
The chart below, which you can click on for greater detail, shows that Ito En had JP¥71.2b in debt in October 2023; about the same as the year before. However, its balance sheet shows it holds JP¥114.1b in cash, so it actually has JP¥42.9b net cash.
How Healthy Is Ito En's Balance Sheet?
The latest balance sheet data shows that Ito En had liabilities of JP¥94.0b due within a year, and liabilities of JP¥76.8b falling due after that. On the other hand, it had cash of JP¥114.1b and JP¥63.7b worth of receivables due within a year. So it can boast JP¥7.01b more liquid assets than total liabilities.
Having regard to Ito En's size, it seems that its liquid assets are well balanced with its total liabilities. So while it's hard to imagine that the JP¥438.6b company is struggling for cash, we still think it's worth monitoring its balance sheet. Simply put, the fact that Ito En has more cash than debt is arguably a good indication that it can manage its debt safely.
In addition to that, we're happy to report that Ito En has boosted its EBIT by 31%, thus reducing the spectre of future debt repayments. The balance sheet is clearly the area to focus on when you are analysing debt. But it is future earnings, more than anything, that will determine Ito En's ability to maintain a healthy balance sheet going forward. So if you want to see what the professionals think, you might find this free report on analyst profit forecasts to be interesting.
Finally, a company can only pay off debt with cold hard cash, not accounting profits. While Ito En has net cash on its balance sheet, it's still worth taking a look at its ability to convert earnings before interest and tax (EBIT) to free cash flow, to help us understand how quickly it is building (or eroding) that cash balance. During the last three years, Ito En generated free cash flow amounting to a very robust 84% of its EBIT, more than we'd expect. That positions it well to pay down debt if desirable to do so.
Summing Up
While it is always sensible to investigate a company's debt, in this case Ito En has JP¥42.9b in net cash and a decent-looking balance sheet. And it impressed us with free cash flow of JP¥23b, being 84% of its EBIT. So we don't think Ito En's use of debt is risky. Over time, share prices tend to follow earnings per share, so if you're interested in Ito En, you may well want to click here to check an interactive graph of its earnings per share history.
If you're interested in investing in businesses that can grow profits without the burden of debt, then check out this free list of growing businesses that have net cash on the balance sheet.
New: AI Stock Screener & Alerts
Our new AI Stock Screener scans the market every day to uncover opportunities.
• Dividend Powerhouses (3%+ Yield)
• Undervalued Small Caps with Insider Buying
• High growth Tech and AI Companies
Or build your own from over 50 metrics.
Have feedback on this article? Concerned about the content? Get in touch with us directly. Alternatively, email editorial-team (at) simplywallst.com.
This article by Simply Wall St is general in nature. We provide commentary based on historical data and analyst forecasts only using an unbiased methodology and our articles are not intended to be financial advice. It does not constitute a recommendation to buy or sell any stock, and does not take account of your objectives, or your financial situation. We aim to bring you long-term focused analysis driven by fundamental data. Note that our analysis may not factor in the latest price-sensitive company announcements or qualitative material. Simply Wall St has no position in any stocks mentioned.
About TSE:2593
Ito En
Manufactures and sells green tea beverages in Japan and internationally.
Flawless balance sheet with proven track record.
Market Insights

Advertisement
Community Narratives
Kodiak AI - a potential 100 bagger opportunity?
Fair Value US$14.00|44.7% undervalued
DA
Community Contributor
A Fair Price for a Great Business Facing Real Threats
Fair Value US$383.06|13.0% undervalued
IM
Community Contributor
AXON And Shopify Integration Will Unlock Global Mobile Advertising
Fair Value US$646.30|0% overvalued
AN
Based on Analyst Price Targets