
Advertisement
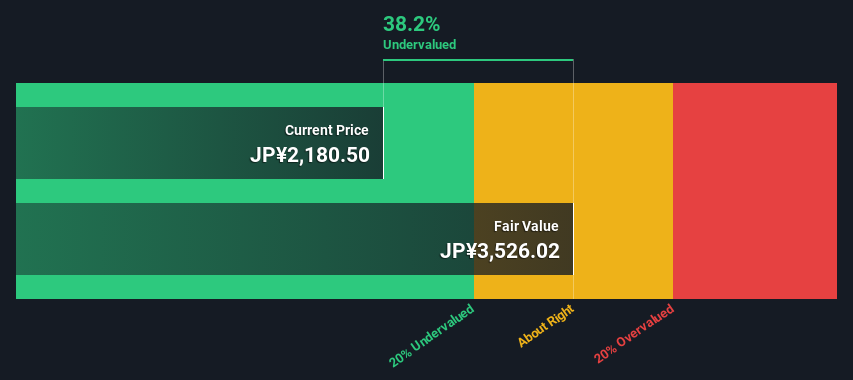
An Intrinsic Calculation For Coca-Cola Bottlers Japan Holdings Inc. (TSE:2579) Suggests It's 38% Undervalued
Key Insights
- Using the 2 Stage Free Cash Flow to Equity, Coca-Cola Bottlers Japan Holdings fair value estimate is JP¥3,526
- Coca-Cola Bottlers Japan Holdings' JP¥2,181 share price signals that it might be 38% undervalued
- Our fair value estimate is 50% higher than Coca-Cola Bottlers Japan Holdings' analyst price target of JP¥2,347
Today we will run through one way of estimating the intrinsic value of Coca-Cola Bottlers Japan Holdings Inc. (TSE:2579) by taking the expected future cash flows and discounting them to their present value. We will take advantage of the Discounted Cash Flow (DCF) model for this purpose. Don't get put off by the jargon, the math behind it is actually quite straightforward.
We generally believe that a company's value is the present value of all of the cash it will generate in the future. However, a DCF is just one valuation metric among many, and it is not without flaws. If you want to learn more about discounted cash flow, the rationale behind this calculation can be read in detail in the Simply Wall St analysis model.
View our latest analysis for Coca-Cola Bottlers Japan Holdings
The Method
We use what is known as a 2-stage model, which simply means we have two different periods of growth rates for the company's cash flows. Generally the first stage is higher growth, and the second stage is a lower growth phase. To begin with, we have to get estimates of the next ten years of cash flows. Where possible we use analyst estimates, but when these aren't available we extrapolate the previous free cash flow (FCF) from the last estimate or reported value. We assume companies with shrinking free cash flow will slow their rate of shrinkage, and that companies with growing free cash flow will see their growth rate slow, over this period. We do this to reflect that growth tends to slow more in the early years than it does in later years.
A DCF is all about the idea that a dollar in the future is less valuable than a dollar today, so we discount the value of these future cash flows to their estimated value in today's dollars:
10-year free cash flow (FCF) estimate
| 2025 | 2026 | 2027 | 2028 | 2029 | 2030 | 2031 | 2032 | 2033 | 2034 | |
| Levered FCF (¥, Millions) | JP¥29.1b | JP¥31.3b | JP¥31.7b | JP¥31.1b | JP¥30.7b | JP¥30.5b | JP¥30.3b | JP¥30.2b | JP¥30.2b | JP¥30.2b |
| Growth Rate Estimate Source | Analyst x4 | Analyst x4 | Analyst x3 | Analyst x1 | Est @ -1.26% | Est @ -0.82% | Est @ -0.51% | Est @ -0.30% | Est @ -0.15% | Est @ -0.05% |
| Present Value (¥, Millions) Discounted @ 4.9% | JP¥27.7k | JP¥28.4k | JP¥27.5k | JP¥25.7k | JP¥24.2k | JP¥22.8k | JP¥21.7k | JP¥20.6k | JP¥19.6k | JP¥18.7k |
("Est" = FCF growth rate estimated by Simply Wall St)
Present Value of 10-year Cash Flow (PVCF) = JP¥237b
We now need to calculate the Terminal Value, which accounts for all the future cash flows after this ten year period. The Gordon Growth formula is used to calculate Terminal Value at a future annual growth rate equal to the 5-year average of the 10-year government bond yield of 0.2%. We discount the terminal cash flows to today's value at a cost of equity of 4.9%.
Terminal Value (TV)= FCF2034 × (1 + g) ÷ (r – g) = JP¥30b× (1 + 0.2%) ÷ (4.9%– 0.2%) = JP¥640b
Present Value of Terminal Value (PVTV)= TV / (1 + r)10= JP¥640b÷ ( 1 + 4.9%)10= JP¥396b
The total value is the sum of cash flows for the next ten years plus the discounted terminal value, which results in the Total Equity Value, which in this case is JP¥633b. The last step is to then divide the equity value by the number of shares outstanding. Compared to the current share price of JP¥2.2k, the company appears quite undervalued at a 38% discount to where the stock price trades currently. Valuations are imprecise instruments though, rather like a telescope - move a few degrees and end up in a different galaxy. Do keep this in mind.
Important Assumptions
Now the most important inputs to a discounted cash flow are the discount rate, and of course, the actual cash flows. If you don't agree with these result, have a go at the calculation yourself and play with the assumptions. The DCF also does not consider the possible cyclicality of an industry, or a company's future capital requirements, so it does not give a full picture of a company's potential performance. Given that we are looking at Coca-Cola Bottlers Japan Holdings as potential shareholders, the cost of equity is used as the discount rate, rather than the cost of capital (or weighted average cost of capital, WACC) which accounts for debt. In this calculation we've used 4.9%, which is based on a levered beta of 0.838. Beta is a measure of a stock's volatility, compared to the market as a whole. We get our beta from the industry average beta of globally comparable companies, with an imposed limit between 0.8 and 2.0, which is a reasonable range for a stable business.
SWOT Analysis for Coca-Cola Bottlers Japan Holdings
Strength
- Debt is not viewed as a risk.
Weakness
- Dividend is low compared to the top 25% of dividend payers in the Beverage market.
Opportunity
- Annual earnings are forecast to grow faster than the Japanese market.
- Trading below our estimate of fair value by more than 20%.
Threat
- Dividends are not covered by earnings.
- Annual revenue is forecast to grow slower than the Japanese market.
Looking Ahead:
Although the valuation of a company is important, it ideally won't be the sole piece of analysis you scrutinize for a company. It's not possible to obtain a foolproof valuation with a DCF model. Rather it should be seen as a guide to "what assumptions need to be true for this stock to be under/overvalued?" For example, changes in the company's cost of equity or the risk free rate can significantly impact the valuation. Why is the intrinsic value higher than the current share price? For Coca-Cola Bottlers Japan Holdings, we've compiled three important elements you should assess:
- Risks: Take risks, for example - Coca-Cola Bottlers Japan Holdings has 2 warning signs we think you should be aware of.
- Future Earnings: How does 2579's growth rate compare to its peers and the wider market? Dig deeper into the analyst consensus number for the upcoming years by interacting with our free analyst growth expectation chart.
- Other High Quality Alternatives: Do you like a good all-rounder? Explore our interactive list of high quality stocks to get an idea of what else is out there you may be missing!
PS. Simply Wall St updates its DCF calculation for every Japanese stock every day, so if you want to find the intrinsic value of any other stock just search here.
New: AI Stock Screener & Alerts
Our new AI Stock Screener scans the market every day to uncover opportunities.
• Dividend Powerhouses (3%+ Yield)
• Undervalued Small Caps with Insider Buying
• High growth Tech and AI Companies
Or build your own from over 50 metrics.
Have feedback on this article? Concerned about the content? Get in touch with us directly. Alternatively, email editorial-team (at) simplywallst.com.
This article by Simply Wall St is general in nature. We provide commentary based on historical data and analyst forecasts only using an unbiased methodology and our articles are not intended to be financial advice. It does not constitute a recommendation to buy or sell any stock, and does not take account of your objectives, or your financial situation. We aim to bring you long-term focused analysis driven by fundamental data. Note that our analysis may not factor in the latest price-sensitive company announcements or qualitative material. Simply Wall St has no position in any stocks mentioned.
Have feedback on this article? Concerned about the content? Get in touch with us directly. Alternatively, email editorial-team@simplywallst.com
About TSE:2579
Coca-Cola Bottlers Japan Holdings
Engages in the purchases, sales, bottling, packaging, distribution and marketing of carbonated beverages, coffee beverages, tea-based beverages, mineral water, and other soft drinks in Japan.
Flawless balance sheet and good value.
Similar Companies
Market Insights

Advertisement
Community Narratives
Kodiak AI - a potential 100 bagger opportunity?
Fair Value US$14.00|44.7% undervalued
DA
Community Contributor
A Fair Price for a Great Business Facing Real Threats
Fair Value US$383.06|13.0% undervalued
IM
Community Contributor
AXON And Shopify Integration Will Unlock Global Mobile Advertising
Fair Value US$646.30|0% overvalued
AN
Based on Analyst Price Targets