
Advertisement
Calbee, Inc.'s (TSE:2229) Intrinsic Value Is Potentially 22% Below Its Share Price
Key Insights
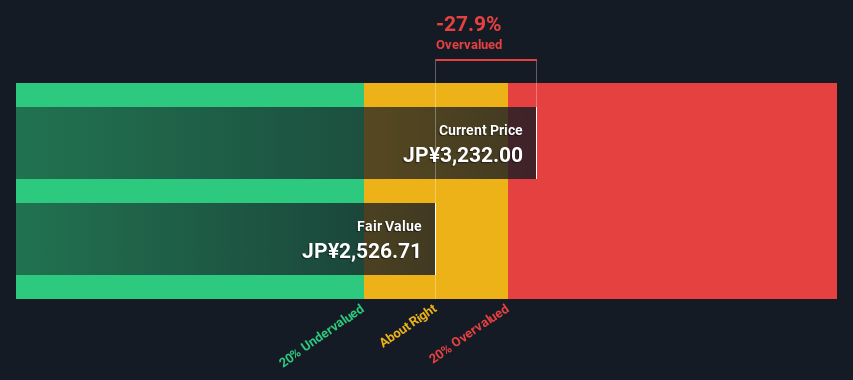
- Using the 2 Stage Free Cash Flow to Equity, Calbee fair value estimate is JP¥2,527
- Calbee's JP¥3,232 share price signals that it might be 28% overvalued
- The JP¥3,470 analyst price target for 2229 is 37% more than our estimate of fair value
Today we'll do a simple run through of a valuation method used to estimate the attractiveness of Calbee, Inc. (TSE:2229) as an investment opportunity by taking the expected future cash flows and discounting them to today's value. This will be done using the Discounted Cash Flow (DCF) model. Don't get put off by the jargon, the math behind it is actually quite straightforward.
Remember though, that there are many ways to estimate a company's value, and a DCF is just one method. Anyone interested in learning a bit more about intrinsic value should have a read of the Simply Wall St analysis model.
See our latest analysis for Calbee
What's The Estimated Valuation?
We use what is known as a 2-stage model, which simply means we have two different periods of growth rates for the company's cash flows. Generally the first stage is higher growth, and the second stage is a lower growth phase. To begin with, we have to get estimates of the next ten years of cash flows. Where possible we use analyst estimates, but when these aren't available we extrapolate the previous free cash flow (FCF) from the last estimate or reported value. We assume companies with shrinking free cash flow will slow their rate of shrinkage, and that companies with growing free cash flow will see their growth rate slow, over this period. We do this to reflect that growth tends to slow more in the early years than it does in later years.
A DCF is all about the idea that a dollar in the future is less valuable than a dollar today, and so the sum of these future cash flows is then discounted to today's value:
10-year free cash flow (FCF) forecast
| 2024 | 2025 | 2026 | 2027 | 2028 | 2029 | 2030 | 2031 | 2032 | 2033 | |
| Levered FCF (¥, Millions) | JP¥1.98b | -JP¥600.3m | JP¥18.4b | JP¥20.0b | JP¥18.0b | JP¥16.9b | JP¥16.1b | JP¥15.7b | JP¥15.3b | JP¥15.1b |
| Growth Rate Estimate Source | Analyst x3 | Analyst x3 | Analyst x3 | Analyst x3 | Analyst x2 | Est @ -6.42% | Est @ -4.43% | Est @ -3.04% | Est @ -2.07% | Est @ -1.39% |
| Present Value (¥, Millions) Discounted @ 4.7% | JP¥1.9k | -JP¥548 | JP¥16.0k | JP¥16.6k | JP¥14.3k | JP¥12.8k | JP¥11.7k | JP¥10.8k | JP¥10.1k | JP¥9.5k |
("Est" = FCF growth rate estimated by Simply Wall St)
Present Value of 10-year Cash Flow (PVCF) = JP¥103b
We now need to calculate the Terminal Value, which accounts for all the future cash flows after this ten year period. The Gordon Growth formula is used to calculate Terminal Value at a future annual growth rate equal to the 5-year average of the 10-year government bond yield of 0.2%. We discount the terminal cash flows to today's value at a cost of equity of 4.7%.
Terminal Value (TV)= FCF2033 × (1 + g) ÷ (r – g) = JP¥15b× (1 + 0.2%) ÷ (4.7%– 0.2%) = JP¥336b
Present Value of Terminal Value (PVTV)= TV / (1 + r)10= JP¥336b÷ ( 1 + 4.7%)10= JP¥212b
The total value, or equity value, is then the sum of the present value of the future cash flows, which in this case is JP¥316b. In the final step we divide the equity value by the number of shares outstanding. Compared to the current share price of JP¥3.2k, the company appears slightly overvalued at the time of writing. Valuations are imprecise instruments though, rather like a telescope - move a few degrees and end up in a different galaxy. Do keep this in mind.
The Assumptions
We would point out that the most important inputs to a discounted cash flow are the discount rate and of course the actual cash flows. You don't have to agree with these inputs, I recommend redoing the calculations yourself and playing with them. The DCF also does not consider the possible cyclicality of an industry, or a company's future capital requirements, so it does not give a full picture of a company's potential performance. Given that we are looking at Calbee as potential shareholders, the cost of equity is used as the discount rate, rather than the cost of capital (or weighted average cost of capital, WACC) which accounts for debt. In this calculation we've used 4.7%, which is based on a levered beta of 0.800. Beta is a measure of a stock's volatility, compared to the market as a whole. We get our beta from the industry average beta of globally comparable companies, with an imposed limit between 0.8 and 2.0, which is a reasonable range for a stable business.
SWOT Analysis for Calbee
Strength
- Earnings growth over the past year exceeded the industry.
- Debt is not viewed as a risk.
Weakness
- Dividend is low compared to the top 25% of dividend payers in the Food market.
- Expensive based on P/E ratio and estimated fair value.
Opportunity
- Annual earnings are forecast to grow for the next 4 years.
Threat
- Paying a dividend but company has no free cash flows.
- Annual earnings are forecast to grow slower than the Japanese market.
Next Steps:
Valuation is only one side of the coin in terms of building your investment thesis, and it ideally won't be the sole piece of analysis you scrutinize for a company. The DCF model is not a perfect stock valuation tool. Preferably you'd apply different cases and assumptions and see how they would impact the company's valuation. For instance, if the terminal value growth rate is adjusted slightly, it can dramatically alter the overall result. Why is the intrinsic value lower than the current share price? For Calbee, we've compiled three relevant items you should further examine:
- Risks: For example, we've discovered 1 warning sign for Calbee that you should be aware of before investing here.
- Future Earnings: How does 2229's growth rate compare to its peers and the wider market? Dig deeper into the analyst consensus number for the upcoming years by interacting with our free analyst growth expectation chart.
- Other Solid Businesses: Low debt, high returns on equity and good past performance are fundamental to a strong business. Why not explore our interactive list of stocks with solid business fundamentals to see if there are other companies you may not have considered!
PS. Simply Wall St updates its DCF calculation for every Japanese stock every day, so if you want to find the intrinsic value of any other stock just search here.
New: AI Stock Screener & Alerts
Our new AI Stock Screener scans the market every day to uncover opportunities.
• Dividend Powerhouses (3%+ Yield)
• Undervalued Small Caps with Insider Buying
• High growth Tech and AI Companies
Or build your own from over 50 metrics.
Have feedback on this article? Concerned about the content? Get in touch with us directly. Alternatively, email editorial-team (at) simplywallst.com.
This article by Simply Wall St is general in nature. We provide commentary based on historical data and analyst forecasts only using an unbiased methodology and our articles are not intended to be financial advice. It does not constitute a recommendation to buy or sell any stock, and does not take account of your objectives, or your financial situation. We aim to bring you long-term focused analysis driven by fundamental data. Note that our analysis may not factor in the latest price-sensitive company announcements or qualitative material. Simply Wall St has no position in any stocks mentioned.
About TSE:2229
Calbee
Engages in the production and sale of snacks and other food products in Japan, North America, Greater China, Thailand, Singapore, Australia, rest of Asia, Hong Kong, the United Kingdom, Indonesia, and internationally.
Excellent balance sheet average dividend payer.
Similar Companies
Market Insights

Advertisement
Community Narratives
Finding The True Value Of A Logistics Powerhouse
Fair Value US$95.21|8.4% undervalued
NV
Community Contributor
Paradigm Biopharmaceuticals Will Lead Osteoarthritis Treatment with Zilosul's FDA Success
Fair Value AU$5.50|91.9% undervalued
AM
Community Contributor
Barrick Mining (ABX:CA): A Gold Hedge against a U.S. Shutdown
Fair Value CA$60.00|25.8% undervalued
GM
Community Contributor